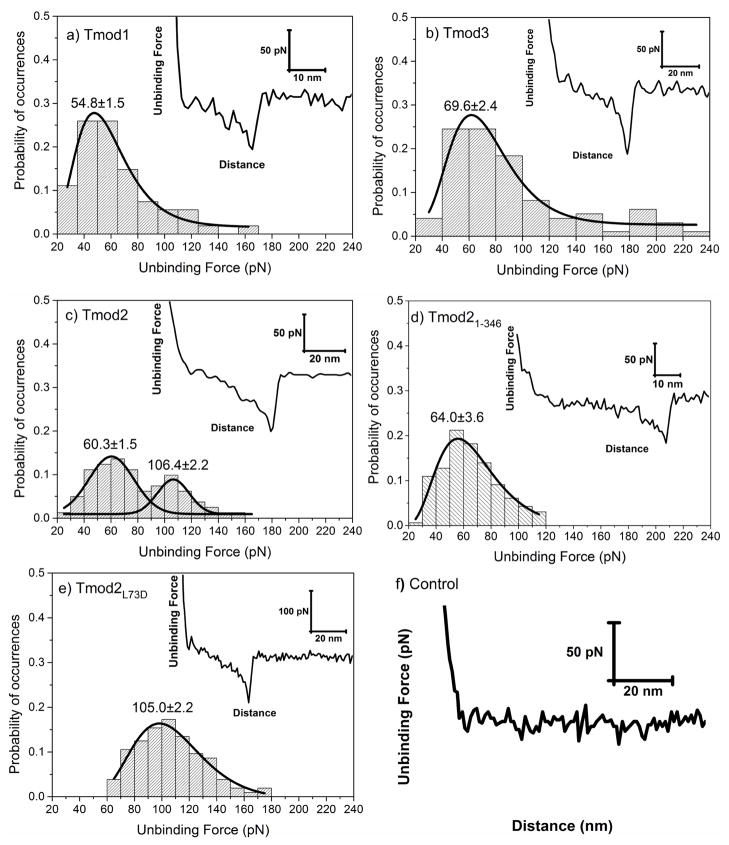
Figure 3.
Distribution of unbinding forces measured between G-actin and a) Tmod1, b) Tmod3, c) Tmod2, d) Tmod21-346, and e) Tmod2[L73D], respectively. Insets show representative retraction force-curves with specific protein-protein unbinding force peaks. Solid lines show a dynamic peak function model fits to the data presented in the histograms (Origin 9.0, OriginLab Corp., Northampton, MA) (R2>0.95). Lognormal peak function was used for unimodal distribution whereas Gaussian peak function was used for bimodal distributions. Peak values estimated from dynamic peak function fitting representing the most probable values are given as insets. Tmod2 shows bimodal distribution suggesting that multiple actin binding sites are involved in the interactions to G-actin. Note that peak value of Tmod21-346 (64.0±3.6) is similar to the first peak value of Tmod2 (60.3±1.5) (p>0.05). f) Retraction force curve measured between Tmod11-344[L71D] and G-actin. The interactions between Tmod11-344[L71D] and G-actin were purely repulsive displaying no specific or nonspecific interactions.

