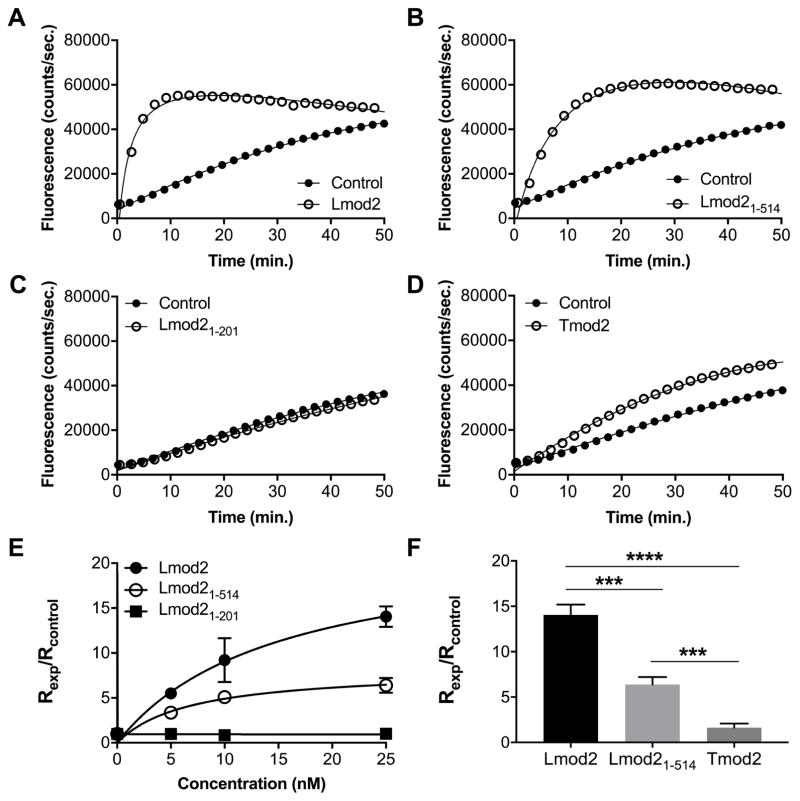
Figure 5.
Nucleation of actin polymerization by Lmod2. 1 μM actin was polymerized in the presence of Tmod2 or Lmod2, full-length or fragments. Representative actin polymerization curves in the presence of 25 nM Lmod2 (A–C) or Tmod2 (D) (control: actin only). E: Concentration dependence of the polymerization rates in the presence of Lmod2. F: Comparison of the polymerization rates in the presence of 25 nM Tmod2 or Lmod2. Rates of polymerization (Rexp) were calculated from fluorescence curves and normalized by dividing Rexp by the rate of spontaneous actin polymerization (Rcontrol). Data points are averages and error bars are standard deviations (n=3–4). Asterisks demonstrate statistically significant differences between groups that were determined by Student’s t-test (***p<0.001, ****p<0.0001).

