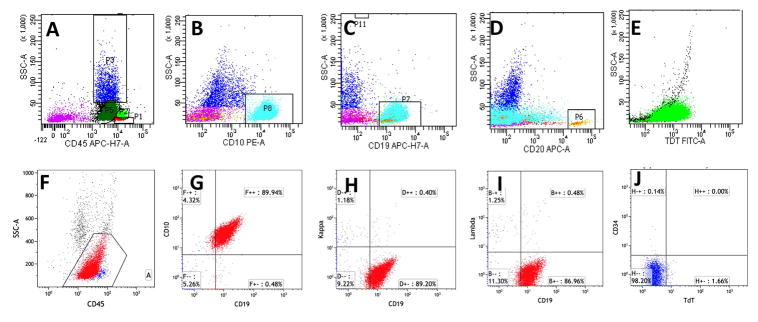
Fig. 3. Flow cytometry analysis of bone marrow.
In case 1, the atypical lymphoid cells showed dim CD45 and lower side scatter (A, dark green), with expression of CD10 (B, cyan), CD19 (C, cyan), dim-to-absent expression of CD20 (D, cyan), and TdT (E, green); In case 2, the atypical lymphoid cells with dim CD45 and low side scatter gate (F) showed expression of CD19 (G), without expression of kappa (H) and lambda (I) light chains. Only few cells expressed dim CD34 or TdT (<5% of gated events, J).

