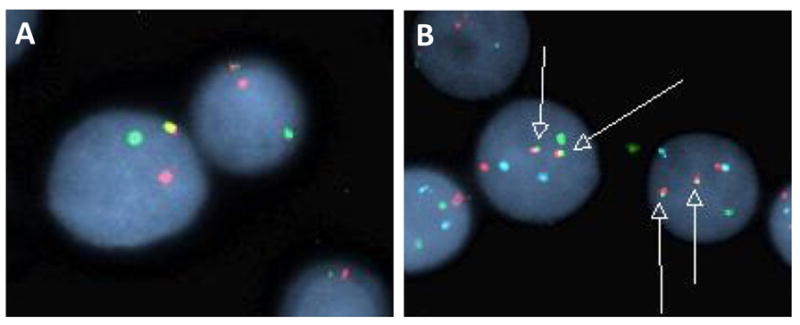
Fig. 4. FISH analysis of bone marrow, Case 1.

A. Breakapart probe with red fluorochrome labeling 5′MYC and the green fluorochrome labeling 3′MYC. Result shows split of red-green signals in tumor cells. B. Dual color double fusion probes with the red fluorochrome directly labeling MYC spanning the known breakpoints (8q24), the green fluorochrome directly labeling the known breakpoints of IGH (14q32), and an aqua fluorochrome directed at the alpha satellite centromeric region of chromosome 8 (D8Z2). Result indicates one separate red signal, one separate green signal and two orange/green fusion signals (arrows) indicating the MYC/IGH translocation.
