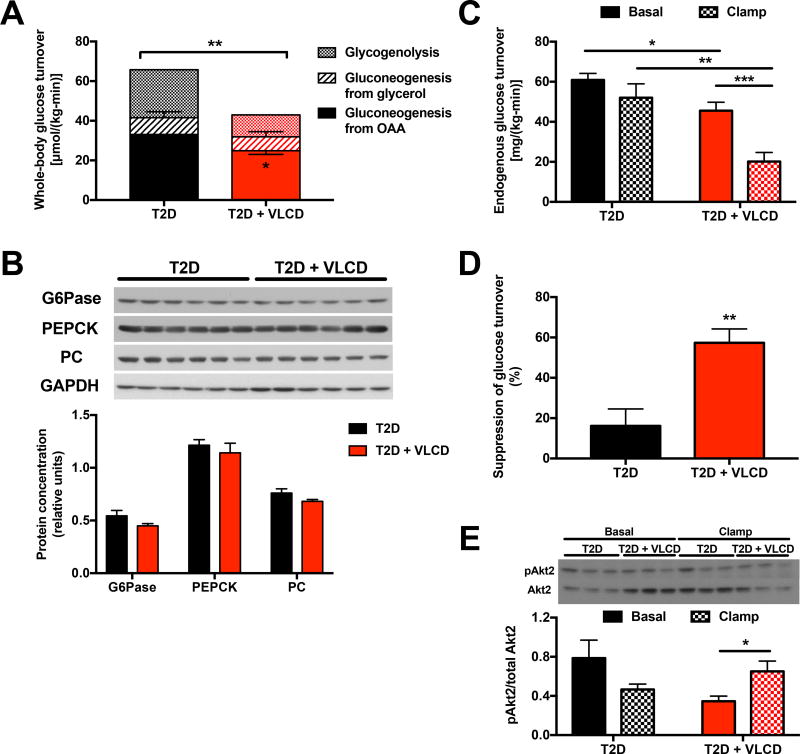
Fig. 2. Caloric restriction lowers the rate of hepatic glucose production due to contributions from both net hepatic glycogenolysis and pyruvate carboxylase (VPC) flux and improves hepatic insulin sensitivity.
(A) Glucose production from glycogenolysis, glycerol, and oxaloacetate. The asterisk in the T2D + VLCD bar indicates P<0.05 comparing gluconeogenesis from OAA between T2D and T2D + VLCD rats. (B) Gluconeogenic enzyme protein expression, normalized to GAPDH. (C) Endogenous glucose turnover under basal and hyperinsulinemic-euglycemic clamp conditions. Comparisons between basal and clamp were performed using the 2-tailed paired Student’s t-test. (D) Suppression of hepatic glucose production in the clamp. (E) Ratio of phosphorylated Akt2 to total Akt2. In all panels, *P<0.05, **P<0.01, ***P<0.001. Data are the mean±S.E.M. of n=6 per group, with comparisons by the 2-tailed unpaired Student’s t-test unless otherwise specified. See also Fig. S2.

