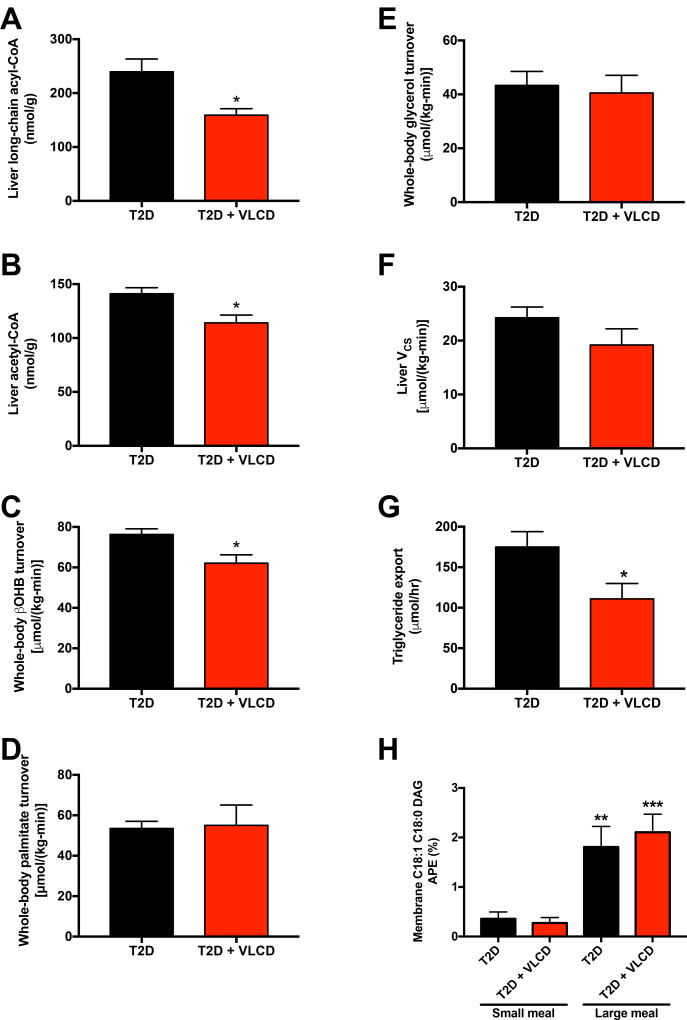
Fig. 3. Caloric restriction lowers hepatic acetyl-CoA content but does not alter substrate oxidation or lipolysis.
(A)–(B) Hepatic long-chain and acetyl-CoA. (C) Whole-body βOHB turnover. (D)–(E) Whole-body palmitate and glycerol turnover. (F) Liver VCS flux. (G) Hepatic triglyceride export. (H) Hepatic membrane C18:1 C18:0 DAG enrichment following a mixed-meal tolerance with [1-13C]triolein. n=7 T2D-small meal, 8 T2D + VLCD-small meal, 7 T2D-large meal, and 7 T2D + VLCD-large meal. **P<0.01, ***P<0.001, referring to the comparison of rats within the same group (control or VLCD) fed a small vs. large meal. In all panels, groups were compared by t-test, and *P<0.05. Unless otherwise specified, the data are the mean±S.E.M. of n=6 per group. See also Fig. S3.

