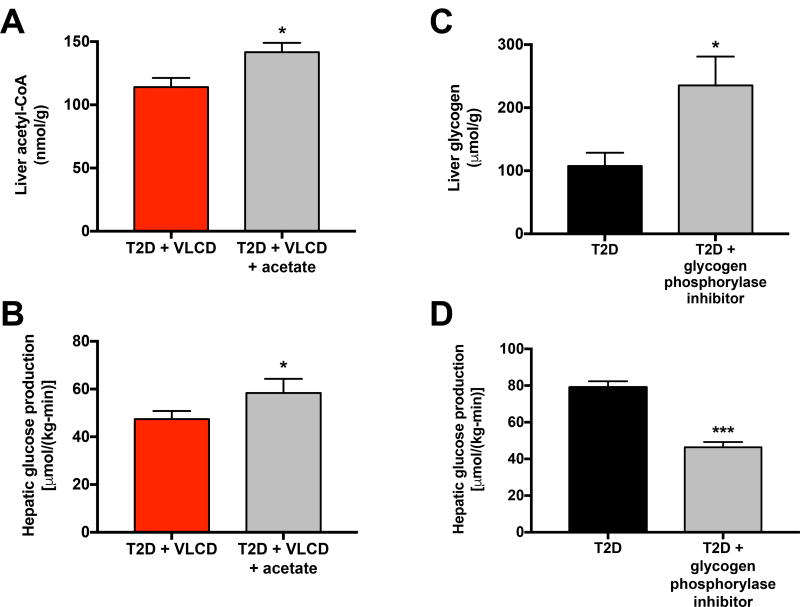
Fig. 4. Increased hepatic acetyl-CoA content and increased rates of net hepatic glycogenolysis contribute to increased rates hepatic glucose production in T2D rats.
(A) Acetyl-CoA content in T2D + VLCD rats (copied from Fig. 3B for comparison) and rats treated with an infusion of acetate. In panels (A) and (C), comparisons were performed using the 2-tailed unpaired Student’s t-test. (B) EGP before and after acetate infusion. Data in panels (B) and (D) were compared by the 2-tailed paired Student’s t-test. (C) Liver glycogen in T2D rats (copied from Fig. S2) and T2D rats treated with a glycogen phosphorylase inhibitor. (D) EGP before and after treatment with the phosphorylase inhibitor. In all panels, *P<0.05, ***P<0.001. Data are the mean±S.E.M. of n=6 per group. See also Fig. S4.

