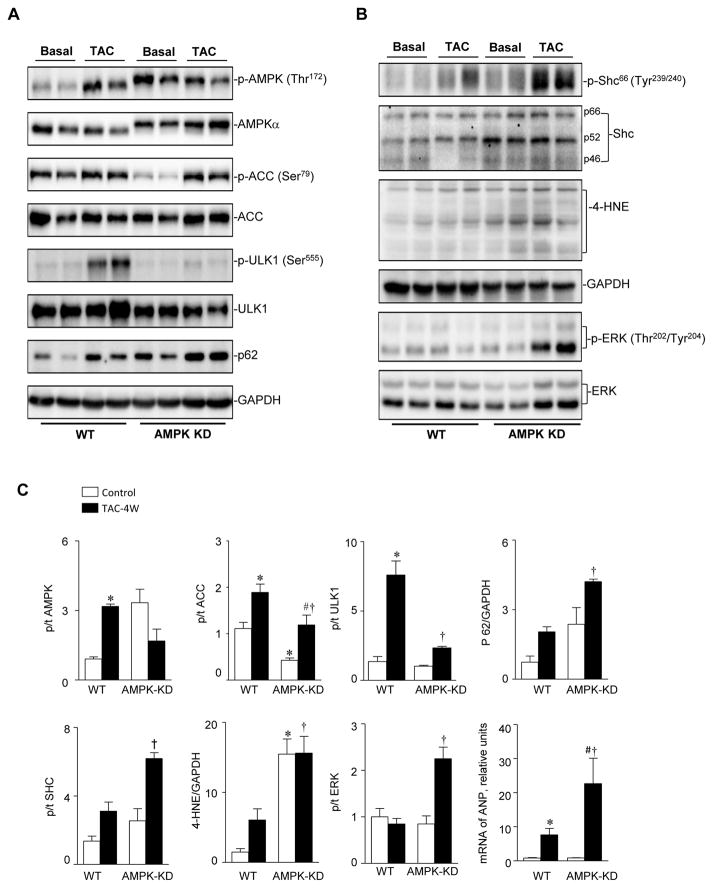
Figure 3.
AMPK-KD mice have impaired levels of p-ACC and p-ULK1 during pressure overload. (A) Immunoblotting of p-AMPK, AMPKα, p-ACC, ACC, p-ULK1, ULK1 and p62 to show the protein expression levels and phosphorylation modification levels. (B) Immunoblotting of p-Shc66, Shc, 4-HNE, p-ERK, and ERK to show protein expression levels and oxidation or phosphorylation modification levels. (C) The quantification of expression levels and modification levels of proteins. Values are means ± SE, n=4–5 per group *p<0.05 vs. WT control, #p<0.05 vs. AMPK-KD control, †p<0.05 vs. WT TAC. p/t in y-axis represents the ratio of the phosphorylated to total level of indicated molecules.

