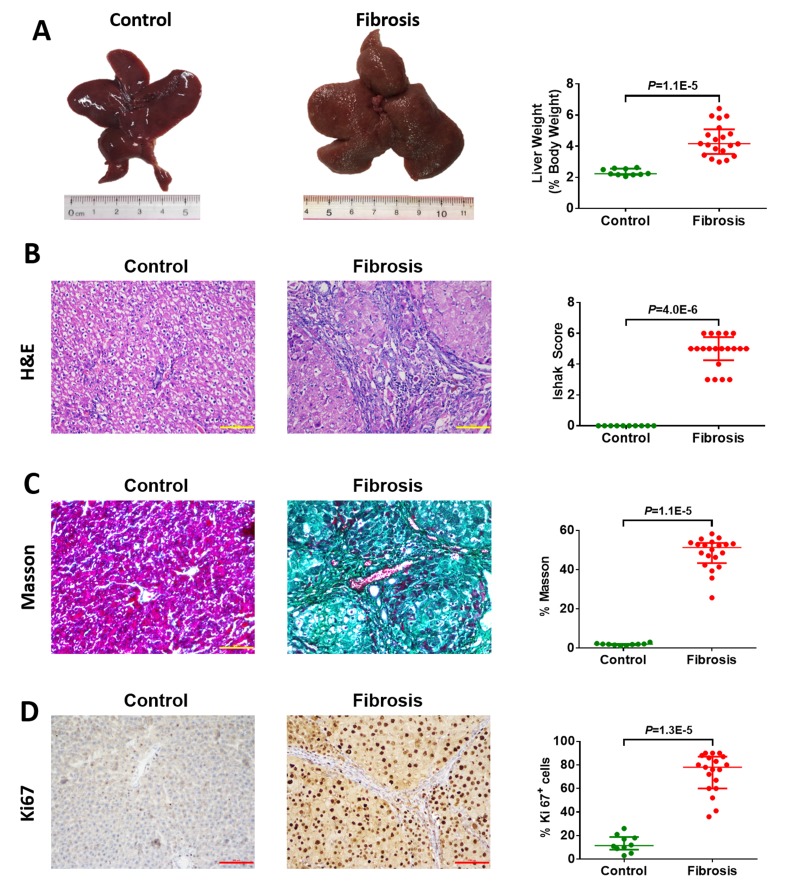
Figure 2. Macroscopic and microscopic findings on control liver tissue (n=10) and diethylnitrosamine (DEN)-induced hepatofibrotic liver tissue (n=20) in male rats.
(A) Representative rat livers at week 12. Representative haematoxylin-eosin (H&E) (B), trichrome staining (C), and Ki67 staining (D) of liver tissue (magnification 200×) at week 12. Data are expressed as the median with interquartile range; by Mann-Whitney U test.

