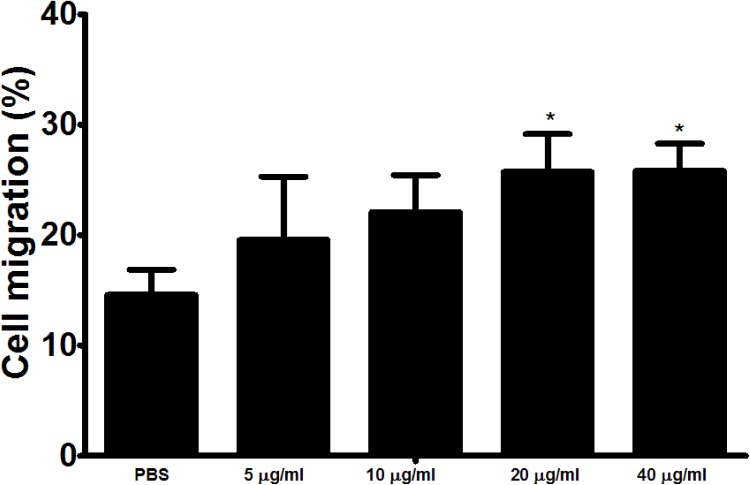
Figure 6. Impact of the various concentration of rHcARF1 on PBMC migration.
PBMC were treated with control buffer and different concentrations of rHcARF1, Then the random migration was determined. The difference between the mean values was calculated using ANOVA. Data are representative of 3 independent experiments; *p < 0.01versus the control.

