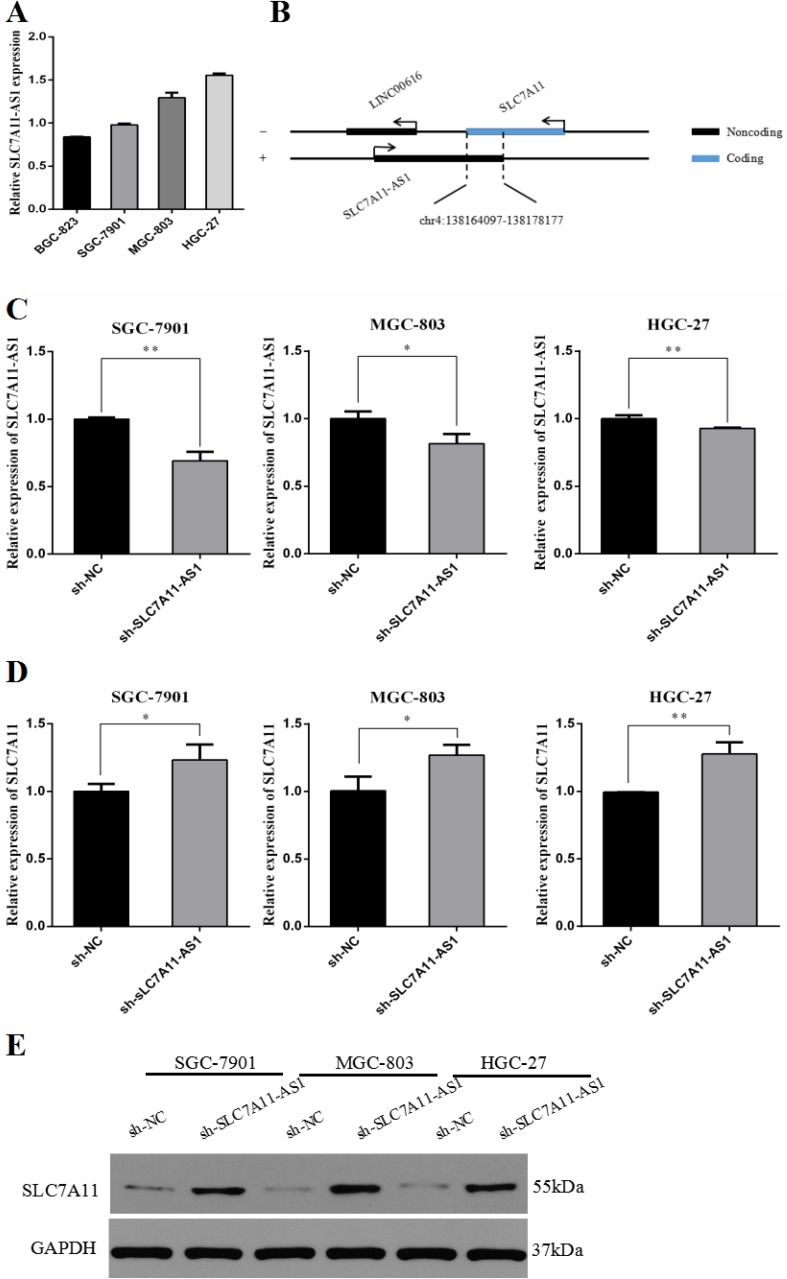
Figure 6. The expression of SLC7A11-AS1 and SLC7A11 were changed after transfection of SLC7A11-AS1 specific shRNA or negative control shRNA.
(A) The relative expression of SLC7A11-AS1 was measured in various cell lines were detected by qPCR, including 4 GC cell lines (SGC-7901, BGC-823, MGC-803 and HGC-27). (B) Schematic diagram was for exhibiting the location between SLC7A11-AS1 and SLC7A11. (C) SLC7A11-AS1 knocked down in SGC-7901 (P=0.001), MGC-803 (P = 0.023) and HGC-27 (P = 0.008) cells infected adenovirus shRNA by sh-NC and sh-SLC7A11-AS1 vector. (D) The SLC7A11 expression level was up-regulated in SGC-7901 (P = 0.034), MGC-803 (P = 0.025) and HGC-27 (P = 0.005) cells after knocked down SLC7A11-AS1. Expression levels were normalized to GAPDH levels. (E) The SLC7A11 protein level was up-regulated in SGC-7901, MGC-803 and HGC-27 cells after knocked down SLC7A11-AS1. Expression levels were normalized to GAPDH levels. Results are shown as mean ± SEM. (*P < 0.05, **P < 0.01, two-tailed Student's t-test)

