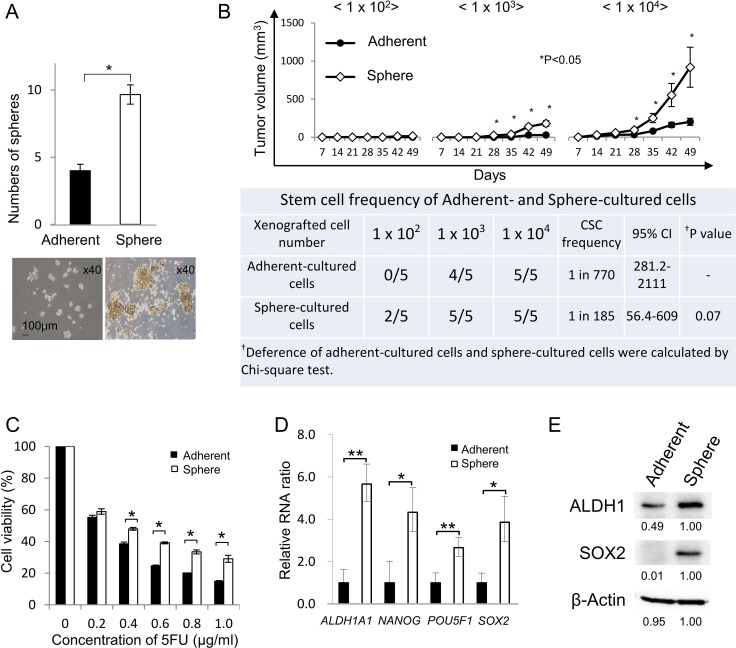
Figure 1. Isolation of CR-CSCs/CICs from human primary CRCs.
(A) Sphere-forming ability of sphere-cultured cells and adherent-cultured cells. Human primary colorectal cancer cells (CRC21) were cultured in serum-free sphere culture and serum adherent culture conditions. The sphere-forming ability of sphere-cultured cells and adherent-cultured cells was examined. Spheres derived from 2500 adherent-cultured cells and from 2500 sphere-cultured cells were counted. Data are shown as means ± SD. An asterisk indicates statistical difference. Representative images of spheroids derived from adherent- and sphere-cultured cells are shown. (B) In vivo tumorigenicity of sphere-cultured cells and adherent-cultured cells. Upper panel: Tumor growth of adherent-cultured cells and sphere-cultured cells. 1.0 × 10², 1.0 × 10³ and 1.0 × 10⁴ cells were injected in the middle backspace of each of the recipient mice under anesthesia and tumors were monitored every week until 7 weeks after injection (n = 5). Data are shown as means ± SD. An asterisk indicates statistical difference. Lower table: Summary of tumor initiation. Estimated CSC ratio was calculated by the ELDA web site. CI: confidence interval. (C) Resistance to 5-FU. Adherent- and sphere-cultured cells were incubated in a culture medium containing 5-FU at several concentrations for 4 days. Cell viability was examined by the WST-1 assay. Data are shown as means ± SD. An asterisk indicates statistical difference. (D) Quantitative RT-PCR analysis of stem cell-related gene expression in sphere-cultured cells and adherent-cultured cells. The expression levels of ALDH1A1, NANOG, POU5F1 and SOX2 were examined by qRT-PCR using cDNAs derived from adherent-cultured cells and sphere-cultured cells. Data are shown as means ± SD. An asterisk indicates statistical difference. (E) Western blot analysis of ALDH1 and SOX2. The protein expression of ALDH1 and SOX2 was examined using adherent-cultured cells and sphere-cultured cells. Numerical data indicate relative intensity of the bands determined by ImageJ software. β-Actin was used as an internal control.

