Figure 1.
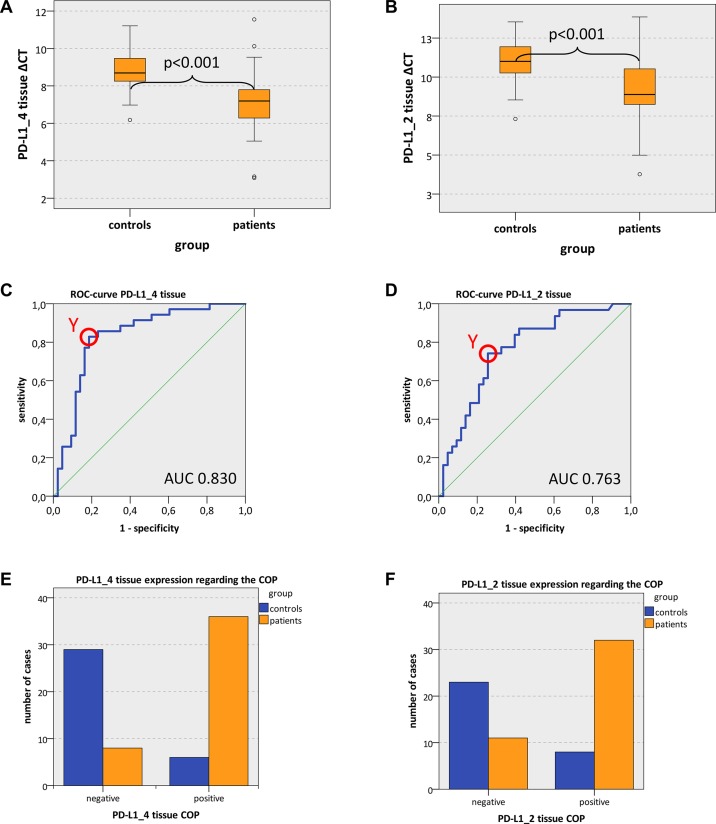
PD-L1 tissue expression in OSCC patients and healthy mucosal controls (A, B) Box plots of the median PD-L1 expression rates in tumor tissue of OSCC patients (group patients) and healthy oral mucosa of volunteers (group controls). The median ΔCT values of PD-L1 splicing variants 1 and 4 (PD-L1_4) (Figure 1A) and splicing variants 1 and 2 (PD-L1_2) (Figure 1B) derived from RT-qPCR are given. Higher ΔCT values indicate lower PD-L1 mRNA expression. The median, the interquartile range and the standard deviation are provided. Statistical analyses were carried out by the Mann-Whitney U test. (C, D) ROC curves for PD-L1 mRNA expression based on the RT-qPCR data. The diagrams are a plot of the sensitivity (true-positive rate) vs. 1-specificity (false-positive rate) over all possible ΔCT values. Data for PD-L1 variant PD-L1_4 (Figure 1C) and variant PD-L1_2 (Figure 1D) are provided. The circles show the points of the highest Youden (Y) indices which are associated with the COP (patients vs. controls). The AUC value is indicated. ROC: receiver operating characteristic, COP: cut-off point, AUC: area under the curve.e, (F) Division of the test and control group (group patients and group controls) into positive and negative subgroups based on the ascertained COPs of PD-L1 variant PD-L1_4 (Figure 1E) and variant PD-L1_2 (Figure 1F) expressed as ΔCT values. Using the χ2 test, the specimens were positively (malignant) judged if the values lied below the COP. Increased PD-L1_4 and PD-L1_2 expression levels in the tissue of OSCC patients (group patients) compared healthy oral mucosa of volunteers (group controls) were significant. Therefore, the COP may be a parameter allowing the allocation of a tissue sample to a group and the proof of malignancy.

