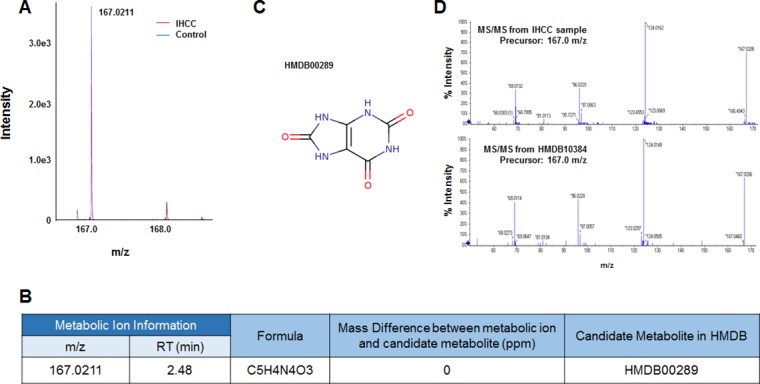
Figure 4. Identification of a metabolic ion of m/z 167.0211 m/z with an RT of 2.48 min.

(A) MS spectrum of the 167.0211 m/z in the negative detection mode. The intensity of the ion was slightly less in serum from IHCC patients (red peaks) compared to controls (blue peaks). (B) The candidate HDMB metabolite giving rise to the ion of 167.0211 m/z. Only one candidate was identified: HMDB00289 (uric acid). (C) Structure of the candidate metabolite. (D) The MS/MS patterns of the 167.0211 m/z from IHCC sera and uric acid. The patterns were identical.
