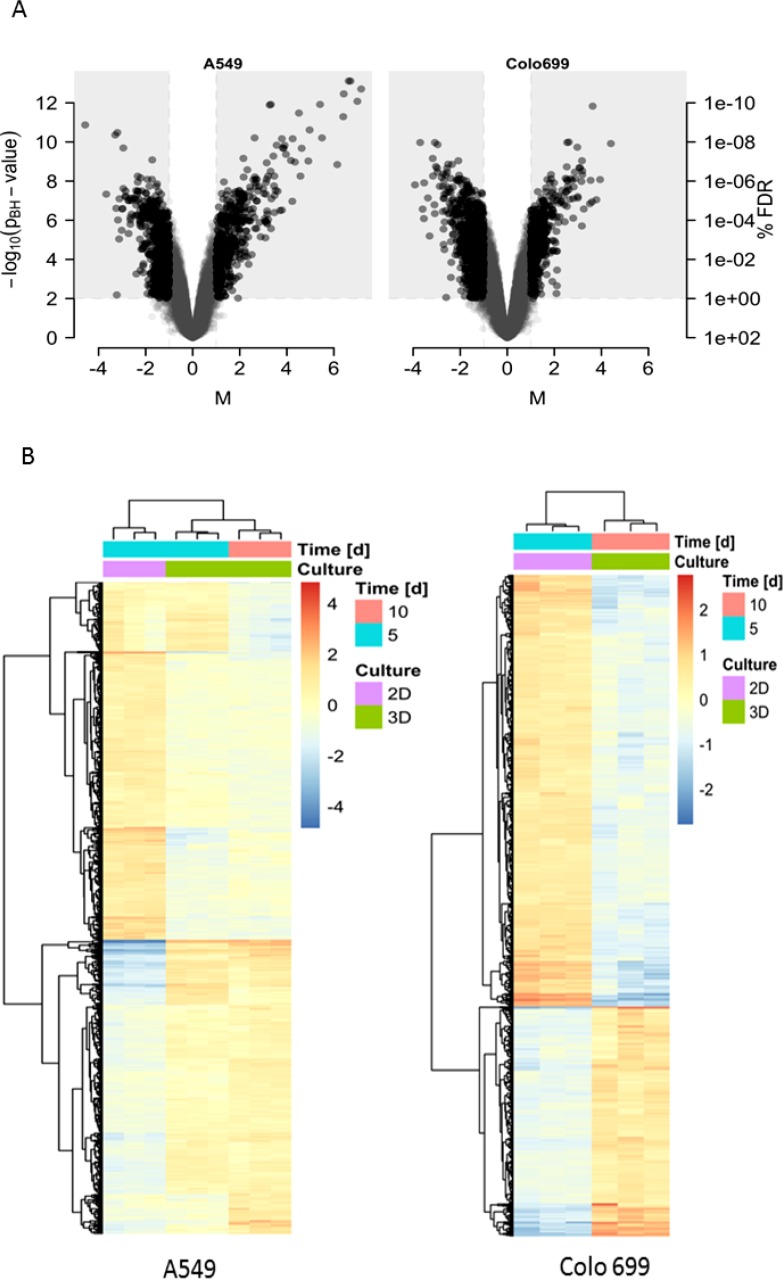
Figure 3. Gene expression differences.
(A) The Volcano plots represent the differences in gene expression between 3D and 2D cell culture conditions for A549 (left) and Colo699 cells (right). The extent of the expression alterations are shown on the x-axis (M or log2 fold change value) against its significance on the y-axis (-log10 of the adjusted p-values). Genes in the light-grey rectangular regions are those defined as significantly altered. (B) The heat maps depicture differentially expressed gene profiles between 2D and 3D cultures for A549 (left) (2D cultures (pink) after 5 days (blue) and 3D cultures (green) after 5 (blue) & 10 (red) days) and Colo699 (right) (2D cultures (pink) after 5 days (blue) and 3D cultures (green) after 10 days (red).

