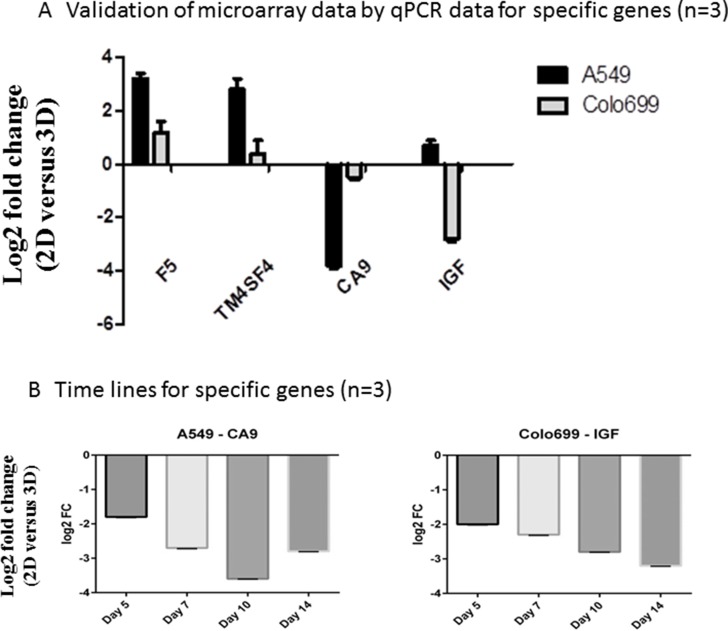
Figure 4. Validation of microarrays by qPCR.
Specific up- and down-regulated genes between 2D and 3D were measured by qPCR in A549 and Colo699 cell lines (A) and time series for the down-regulated genes in A549 and Colo699 (B) were run to provide additional insights in gene expression changes due to cultivation time and underline the chosen time points for the microarrays (n = 3; error bars depict SD).

