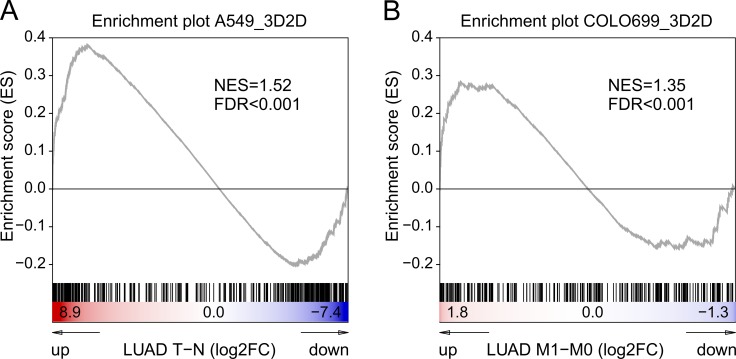
Figure 7. Gene set enrichment analyses 3D versus in-vivo tumor samples.
The enrichment plots depict gene set enrichment analyses of 3D vs 2D up-regulated genes (at least 2FC) in comparison to published NSCLC patient derived data from The Cancer Genome Atlas. For the A549 the regulated gene profiles of the 3D system were tested for their enrichment in tumour tissues compared to normal tissues (LUAD data set; n = 58) (A), whereas in the analyses of Colo699 the 3D profile was compared to changes between metastases and primary tumours (B).

