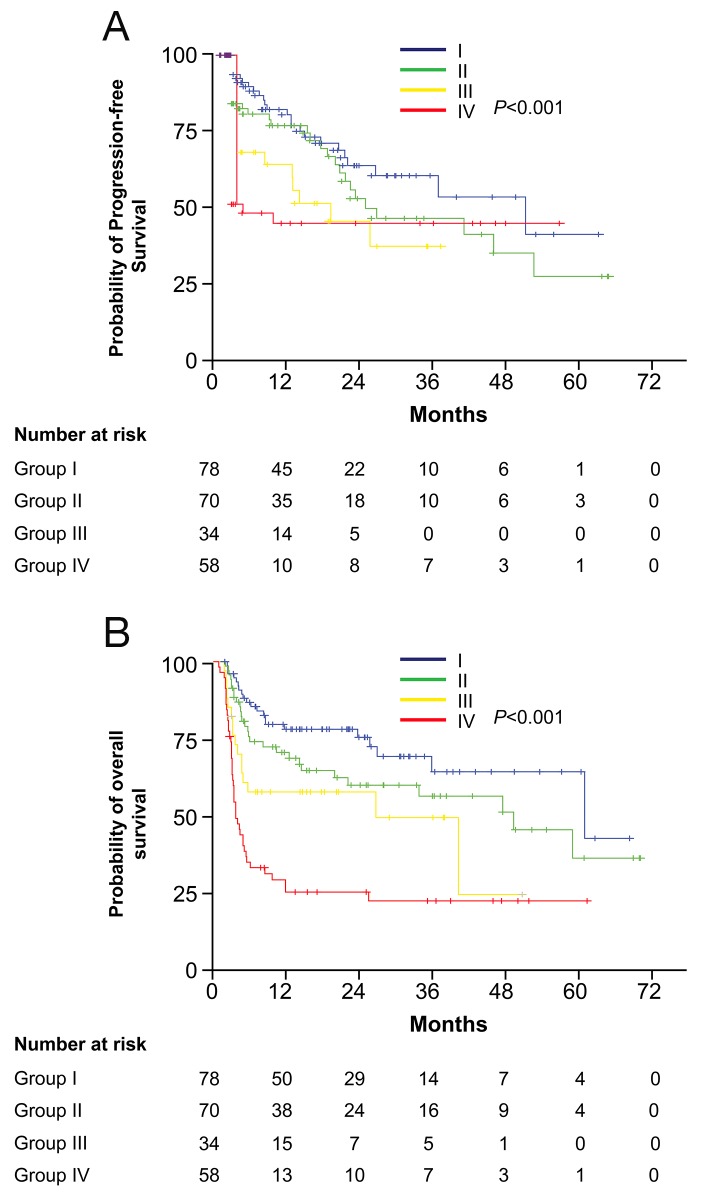
Figure 3.
Kaplan-Meier curves showing PFS (A) and OS (B) probabilities based on the combination of iNOS+ and CD163+ TAM densities in all patients. Patients were classified into four groups according to their iNOS+ and CD163+ TAM densities: group I, high iNOS+ but low CD163+ TAM densities; group II, both low densities; group III, both high densities; group IV, low iNOS+ but high CD163+ TAM densities. The p values were calculated using the log-rank test.

