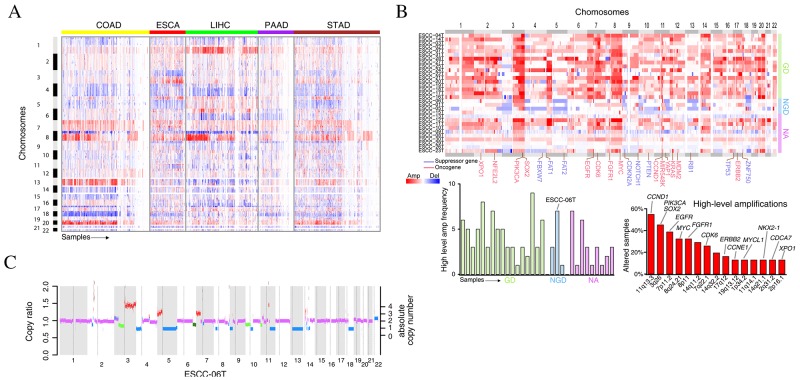
Figure 1. The genome instability in esophageal cancers.
(A) The copy number profiles across five types of gastrointestinal tumors from TCGA datasets. Tumors are plotted by horizontal axis, chromosome positions are arranged vertically. (B) The genome instability of 31 ESCC tumors. The upper panel shows the SCNAs while the bottom panels show the high-level amplification frequency of each tumor (left panel) and gene (right panel). (C) Copy number variations for ESCC-06T. Green segments represent the subclonal deletion.

