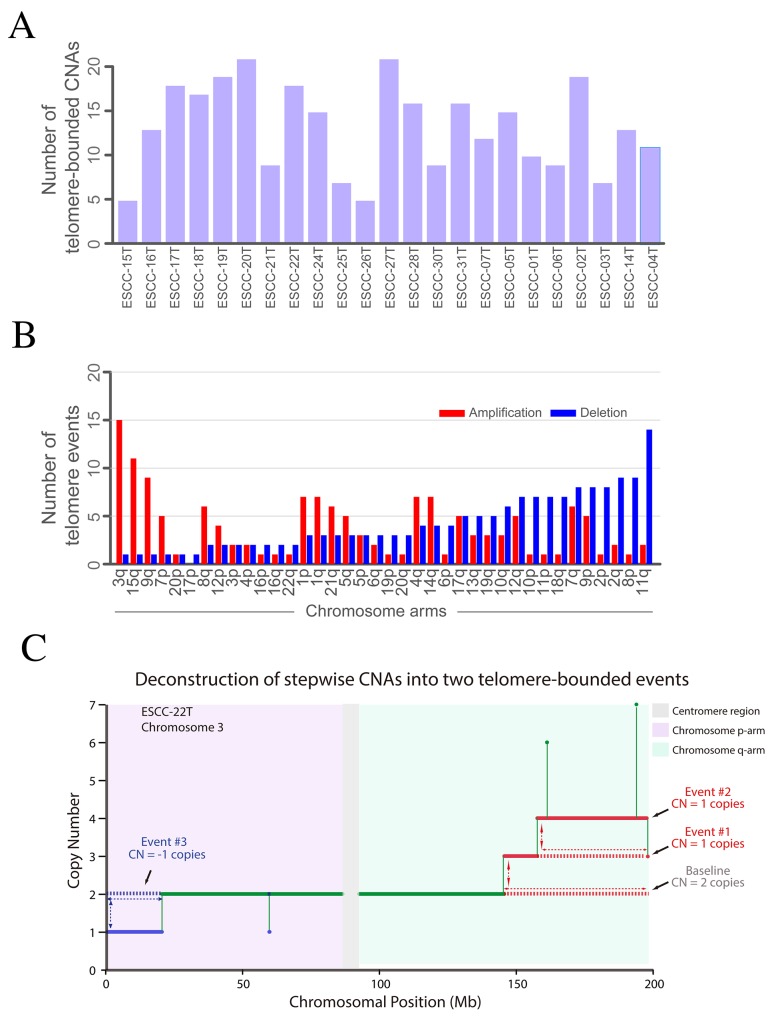
Figure 4. Telomere-bounded copy number changes and targeted amplification across 23 ESCCs.
(A) The distribution of TCNAs in each tumor. (B) The telomere-bounded amplification or deletion for each chromosomal arm. (C) Example of deconstruction of stepwise CNAs in chromosome arm into underlying telomere-bounded copy number alterations. Green line represents copy number baseline with 2 copies, red lines represent two underlying telomere-bounded amplifications, and in contrast, blue line represents telomere-bounded deletion.

