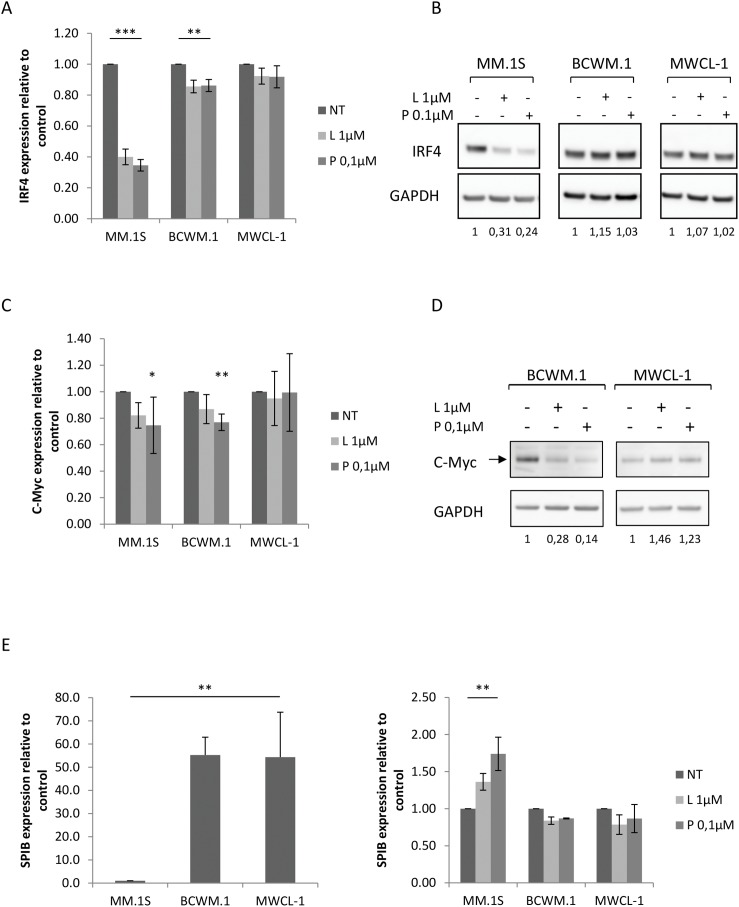
Figure 5. Modulation ofIRF4 regulatory loop in WM cell lines upon lenalidomide and pomalidomide treatment.
(A) Relative mRNA quantitation of IRF4 using qRT-PCR normalized to GAPDH in MM and WM cell lines after 48 hours exposure to lenalidomide and pomalidomide. Upon treatment, mRNA expression is 2.5 and 2.9 times lower respectively in MM.1S cell lines and 1.6 times lower in both conditions in BCWM.1.cell lines. Histograms represent the mean of at least five different experiments +/- SEM. (B) Western blot analysis using anti-IRF4 mouse monoclonal antibody showing the decrease of IRF4 expression after 48 hours exposure to lenalidomide and pomalidomide at the indicated concentrations. Band intensities were quantified using ImageQuant TL software, normalized to their respective GAPDH bands and expressed comparatively to the untreated control. Picture is representative of at least three different experiments. (C) Relative mRNA quantitation of c-Myc using qRT-PCR normalized to GAPDH in MM and WM cell lines and (D) western blot analysis showing a decrease of c-Myc expression in BCWM.1 after 48 hours exposure to lenalidomide and pomalidomide. Band intensities were quantified using ImageQuant TL software, normalized to their respective GAPDH bands and expressed comparatively to the untreated control. Histograms represent the mean of at least three different experiments +/- SD and picture is representative of at least three different experiments. (E) Relative mRNA quantitation of SPIB using qRT-PCR normalized to GAPDH in MM and WM cell lines untreated (left) or upon lenalidomide and pomalidomide (right) exposure. Histograms represent the mean of at least three different experiments +/- SD. *: p<0.05; **: p<0.01; ***: p<0.001 NT: Not Treated; L: Lenalidomide; P: Pomalidomide.

