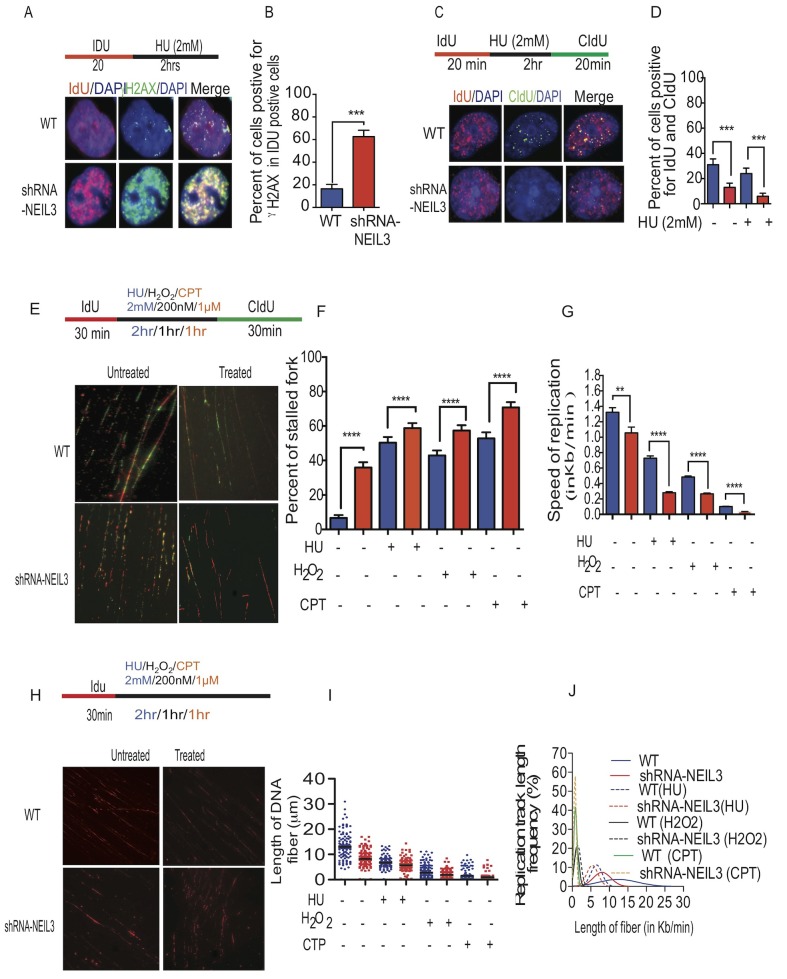
Figure 3. NEIL3 is required for replication fork progression.
(A) Representative images of γH2Ax and IdU colocalization in NEIL3-proficient and NEIL3-deficient cells; (B) Estimated percent of γH2Ax positive cells in IdU positive cells in NEIL3 proficient (n=91) and NEIL3-deficient cells (n=75); (C) Images of IdU and CIdU co-localization after HU treatment in NEIL3-proficient and NEIL3-deficient cells; (D) Estimated number of cells dual-positive for IdU and CIdU. Note that the number of untreated NEIL3 proficient (n=127) and deficient (n=101) versus treated NEIL3 proficient (n= 125) and NEIL3 deficient cells (n=114); (E) Representative images of replication fibers from NEIL3 proficient and NEIL3-deficient cells after pulse-labeling with 5 μM IdU for 30 min (red track) and 250 μM CIdU for 30 min (green track); (F) Estimated percentage of stalled replication forks in untreated NEIL3-proficient (n=210) and NEIL3-deficient cells (n=226) versus HU treated NEIL3 proficient (n=205) and deficient cells (n=197); H2O2 treated NEIL3 proficient and deficient (n=282; 263); cisplatin (1μM) treated NEIL3 proficient and deficient cells (n=208; 226); (G) Estimated replication fork speed in NEIL3-proficient and NEIL3-deficient cells before (n=169;151) and after HU (n=172; 119), H2O2 (n=302; 159) or cisplatin treatment (n=348; 159). Note that replication fork speed was calculated by dividing the length of each CIdU track (green) by its incubation time (30 min). (H) Schematic representation of DNA fibers from NEIL3 proficient versus NEIL3 deficient cells and images of the visualized nascent DNA strand after treatment. Note that cells were pulsed with IdU for 30 minutes followed by 2mM HU treatment for 2 hours, or H2O2 (1000nM) for 1 hour; cisplatin (CTP; 1μM) for 1 hour then DNA fiber experiment were done as described previously (upper panel); (I) Estimated length of fibers in untreated NEIL3 proficient (n=99) and NEIL3 deficient cells (n=129) versus HU treated NEIL3 proficient (n=110) and NEIL3 deficient cells (n=120); H2O2 treated proficient (n=207) and deficient (n= 207); Cisplatin treated NEIL3 proficient (n=207) and deficient (n=245); (J) Distribution of fiber length in NEIL3 proficient versus deficient cells with or without HU, H2O2 and cisplatin. All data were analyzed using GraphPad Prism software.

