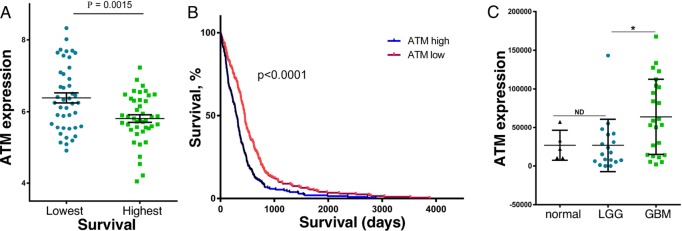
Figure 3. ATM expression in brain cancer patient samples, and the relationship to patient survival.
(A) GBM patients in the TCGA database with the lowest (43 patients) and highest survival (42 patients) were compared for ATM expression. (B) Kaplan-Meier analysis of the survival of GBM patients (422 patients) in the TCGA database that were grouped into high (213 patients) and low (209 patients) ATM expression. (C) RNA was extracted from age-matched and sex-matched FFPE patient biopsies identified as GBM (24 samples), LGG (18 samples) or normal brain tissue (5 samples), and ATM expression was determined by qPCR (n = 3), and normalized to actin expression [37].

