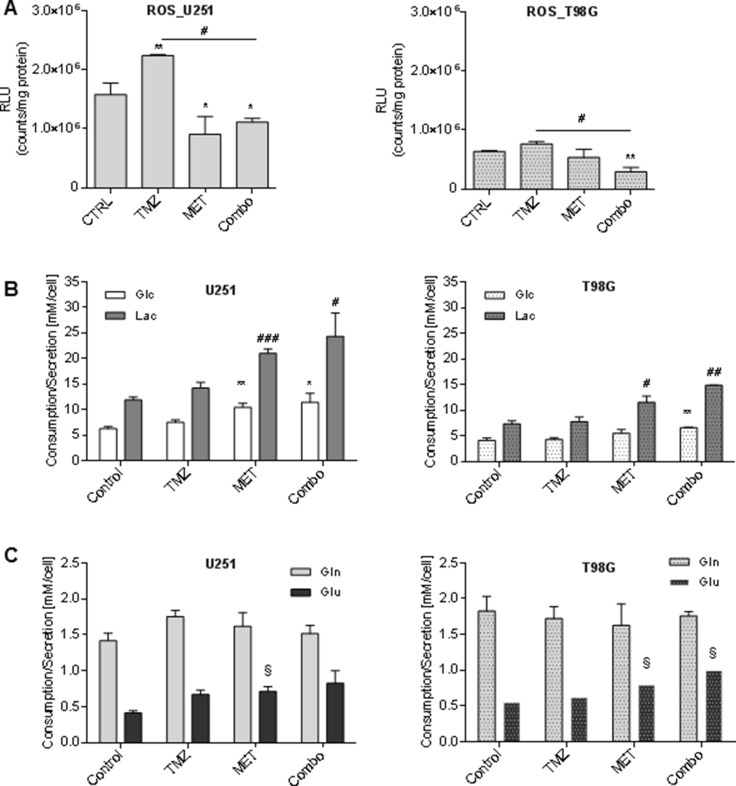
Figure 3. Metformin modulated ROS production and glucose and glutamine metabolism.
(A) Luminescent assay applied to measure the level of hydrogen peroxide (H2O2) in cell culture medium of U251 and T98G after treatment with 25 μM TMZ and/or 10 mM MET. Data were expressed as Relative Luminescence Units (RLU) obtained by luciferase counts normalized to amount of proteins quantified by Bradford assay. (B) Glucose lactate, (C) glutamine and glutamate were measured in cell medium after 48 h of therapy. Data are shown as mean ± standard deviation. *p < 0.05; **p < 0.01;***p < 0.001 vs control sample (untreated cells); #p < 0.05; ##p < 0.01; ###p < 0.001 vs control sample; § p < 0.05 vs control sample (untreated cells).

