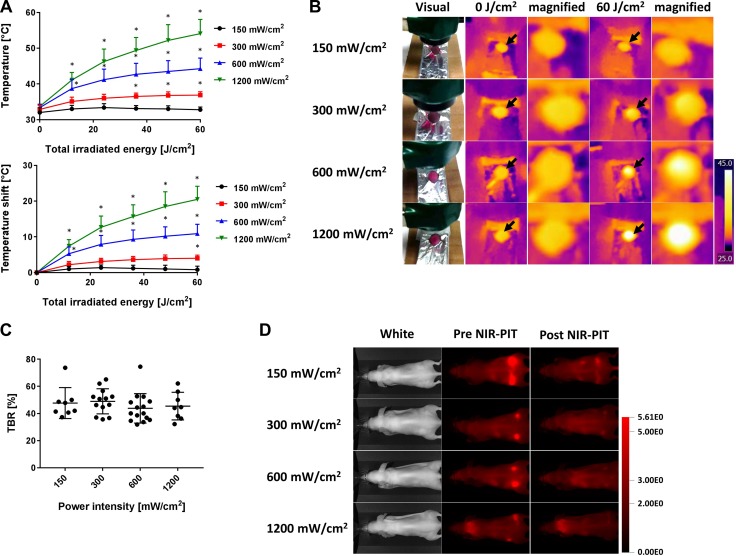
Figure 5. Temperature increases at several of power densities using laser light.
(A) Temperature increases after laser exposure of 60 J/cm2 at each of the following power densities (150, 300, 600 and 1,200 mW/cm2) with air cooling. The lower the power density, the lower was the temperature increase. (B) The visual images and thermal images after laser exposure with different power densities. Black arrows indicate the irradiated areas. At the 60 J/cm2, the higher the power density, the higher the temperature that was exhibited. (C) TBR at 60 J/cm2 in each group. No significant differences were seen among the groups. (D) Fluorescence images of IR700 before and after NIR-PIT at each power density. Data are means ± SEM. n = at least 8 in each group. *P < 0.05 versus the 150 mW/cm2 group.

