Fig. 3.

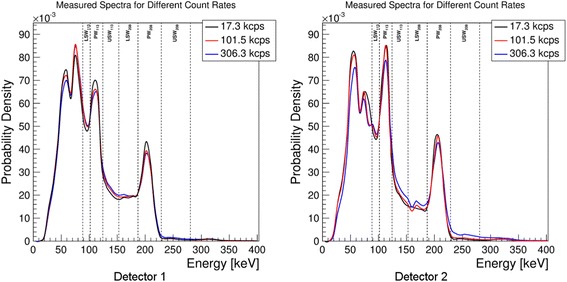
Measured spectra recorded at different count rates for both detectors. The count rates listed in the legend of the plots correspond to the total full spectrum count rates

Measured spectra recorded at different count rates for both detectors. The count rates listed in the legend of the plots correspond to the total full spectrum count rates