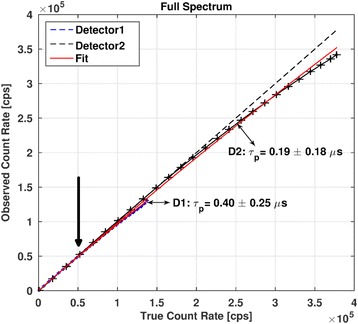
Fig. 4.

Observed count rates vs. true count rates for the full spectrum. The values of τp determined for both detectors are shown. Crosses indicate the measured data points. Typical values of full spectrum count rates in patient studies (indicated by an arrow) range from 50 to 70 kcps (~ 0.6 × 10⁵ cps on this graph)
