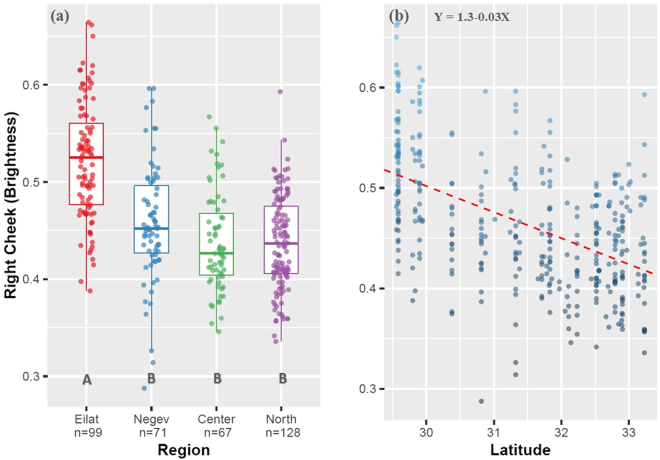
Figure 2.
(a) Results of one-way ANOVA for right cheek brightness. Heavy line within each box represents the median. Limits of boxes represent the 25% and 75% quartiles, and limits of whiskers represent min and max values excluding outliers. Letters below boxes (A, B) represent significant differences in post-hoc analyses. Eilat (A) significantly differs from all other three regions, which are not different from one another (b) Results of regression analysis of right cheek brightness plotted against latitude.

