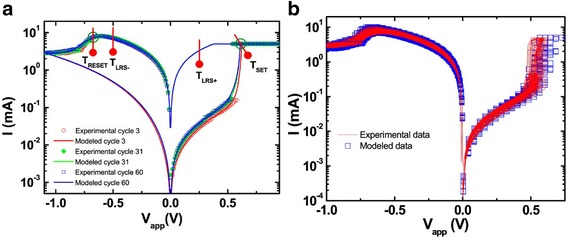
Fig. 15.

a RRAM current versus voltage for different cycles; the CF features are tuned to fit different curves such as rCFTM = 45 nm, rCFTm = 15 nm, and rCFBM = 7 nm for cycle 3, rCFTM = 45 nm, rCFTm = 25 nm, and rCFBM = 7 nm for cycle 31, and rCFTM = 40 nm, rCFTm = 35 nm, and rCFBM = 7.8 nm for cycle 60; b I-V curves for the devices under consideration along with different modeled data (the CFs’ dimensions considered to fit the whole set of curves have been generated randomly). The temperature at the most representative points of the I–V curve, highlighted in a cycle 3: TSET (T,B) = [579,656] K, TLRS+ (T,B) = [349,368] K, TLRS-(T,B) = [466,525] K, TRESET (T,B) = [565,621] K; cycle 31: TSET (T,B) = [573,669] K, TLRS+ (T,B) = [349,368] K, TLRS- (T,B) = [460,525] K, TRESET (T,B) = [566,622] K; cycle 60: TSET (T,B) = [564,685] K, TLRS+ (T,B) = [347,367] K, TLRS- (T,B) = [460,525] K, TRESET (T,B) = [545,641] K [93]
