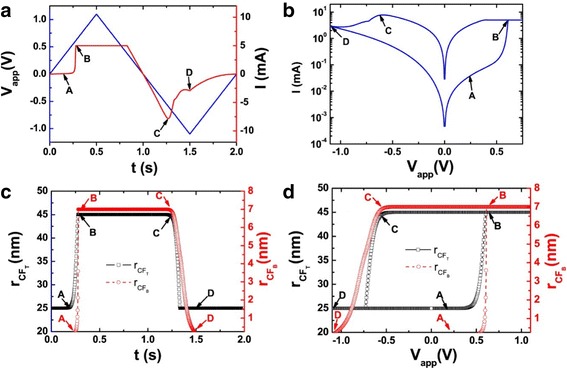
Fig. 16.

a Applied triangular voltage signal (blue) and corresponding device current (red) versus time. b The RRAM current against the applied voltage. c Top and bottom CF radii versus time for the devices under consideration. d Top and bottom CF radii corresponding to figure 7(c) versus applied voltage [93]
