
Fig. 23.
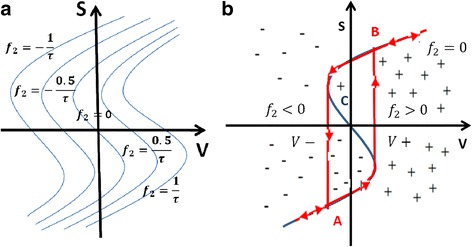
f2 function in (6) plotted in contour form and predicted s-v hysteresis curve depending on the sign of f2 [100]
Official websites use .gov
A
.gov website belongs to an official
government organization in the United States.
Secure .gov websites use HTTPS
A lock (
) or https:// means you've safely
connected to the .gov website. Share sensitive
information only on official, secure websites.
f2 function in (6) plotted in contour form and predicted s-v hysteresis curve depending on the sign of f2 [100]