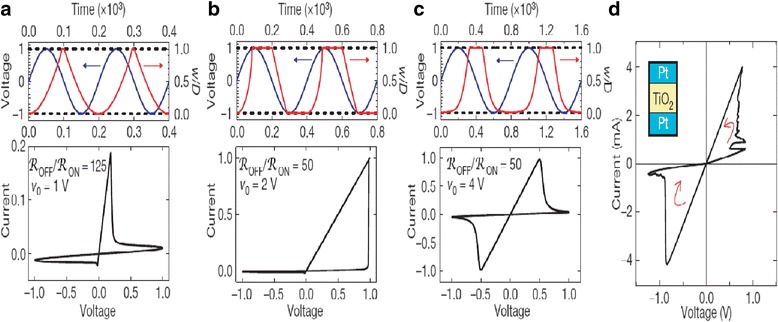
Fig. 3.

Simulated voltage-driven memristive device. a Simulation with dynamic negative differential resistance. b Simulation with no dynamic negative differential resistance. c Simulation governed by nonlinear ionic drift. In the upper plots of a, b, and c, the voltage stimulus (blue) and the corresponding change in the normalized state variable w/D (red) is plotted against time. In all cases, hard switching occurs when w/D closely approaches the boundaries at zero and one (dashed), and the qualitatively different i-v hysteresis shapes are due to the specific dependence of w/D on the electric field near the boundaries. d For comparison, an experimental i–v plot of a Pt–TiO2 − x–Pt device is presented [3]
