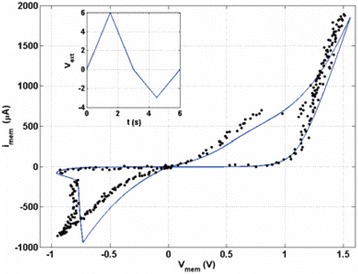
Fig. 7.

Experimental data (black dots) and corresponding simulated I-V curve for the memristor (solid line) where imem is the current through the memristor and vmem is the voltage across the entire memristor. The inset shows the externally applied voltage sweep is shown and the initial condition for w is set at 1.2 nm [72]
