Figure 5.
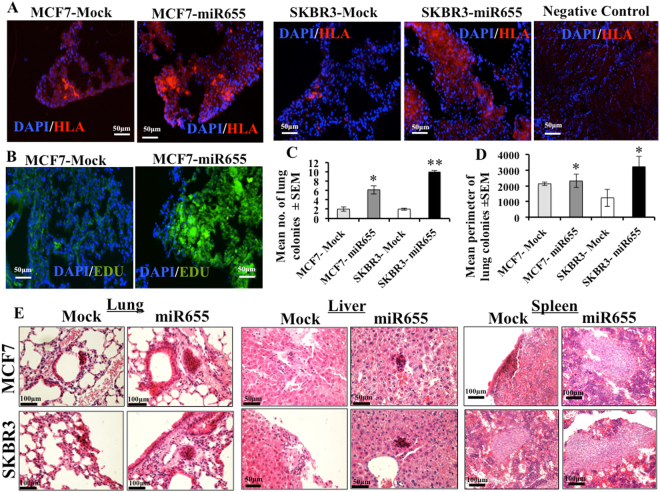
Expression of miR655 supports lung colony formation and multi-organ metastasis. Comparison of lung colony formation by MCF7-miR655 and SKBR3-miR655 cells and respective control cells in GUSB null mice, n = 5 mice per cell line. (A) Representative images of lung sections stained for HLA (red) and DAPI (blue) demonstrating lung colony formation 4 weeks post-injection. (B) Proliferative lung colonies detected with EdU staining. For (A) and (B) scale bar is 50 µm. Quantitative data of HLA staining are presented as mean of (C) lung colonies (>8 cells) and (D) perimeter. Quantitative data are presented as means of triplicate measurements ± SEM. For each lung, 10 sections were screened for colonies. *Indicates p < 0.05, **p < 0.01. (E) Metastatic foci in liver, spleen, and lung are detected with H&E staining. Scale bar is 100 µm.

