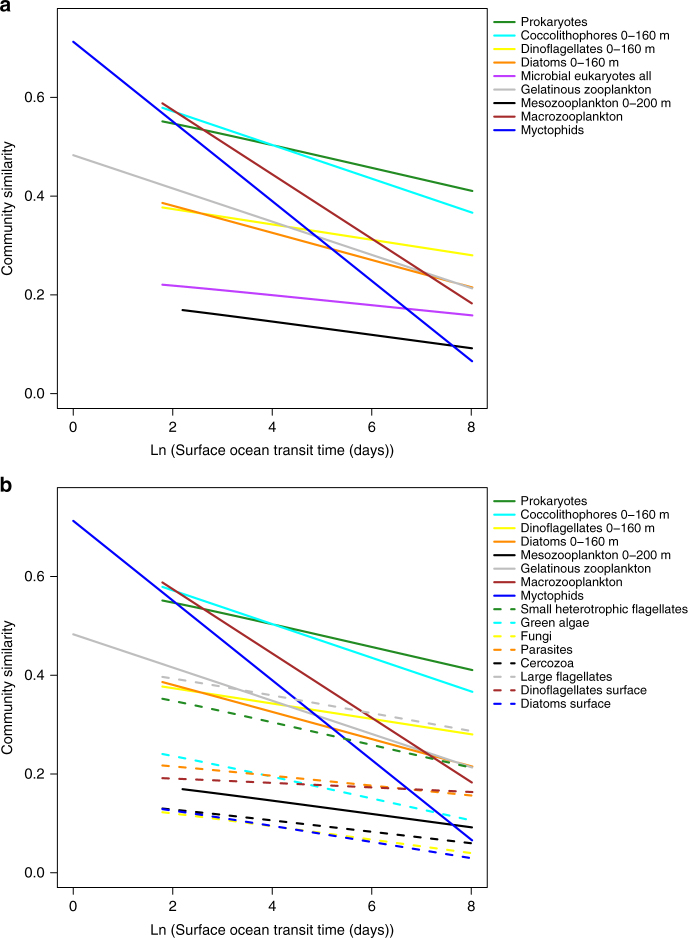
Fig. 1.
Time-decay between community similarity and surface ocean transit time. Time-decay relationship between community similarity using Jaccard similarity index and surface ocean transit time. Each line represents the community similarity decay between the species similarity and the logarithm of the surface ocean transit times for each biological group. a Main biological groups: prokaryotes (green); coccolithophores 0–160 m (cyan); dinoflagellates 0–160 m (yellow); diatoms 0–160 m (orange); microbial eukaryotes all (purple); gelatinous zooplankton (gray); mesozooplankton 0–200 m (black); macrozooplankton (brown); myctophids (blue). b All biological groups: prokaryotes (solid green); coccolithophores 0–160 m (solid cyan); dinoflagellates 0–160 m (solid yellow); diatoms 0–160 m (solid orange); mesozooplankton 0–200 m (solid black); gelatinous zooplankton (solid gray); macrozooplankton (solid brown); myctophids (solid blue); small heterotrophic flagellates (dashed green); green algae (dashed cyan); fungi (dashed yellow); parasites (dashed orange); cercozoa (dashed black); large flagellates (dashed gray); dinoflagellates surface (dashed brown); diatoms surface (dashed blue)

