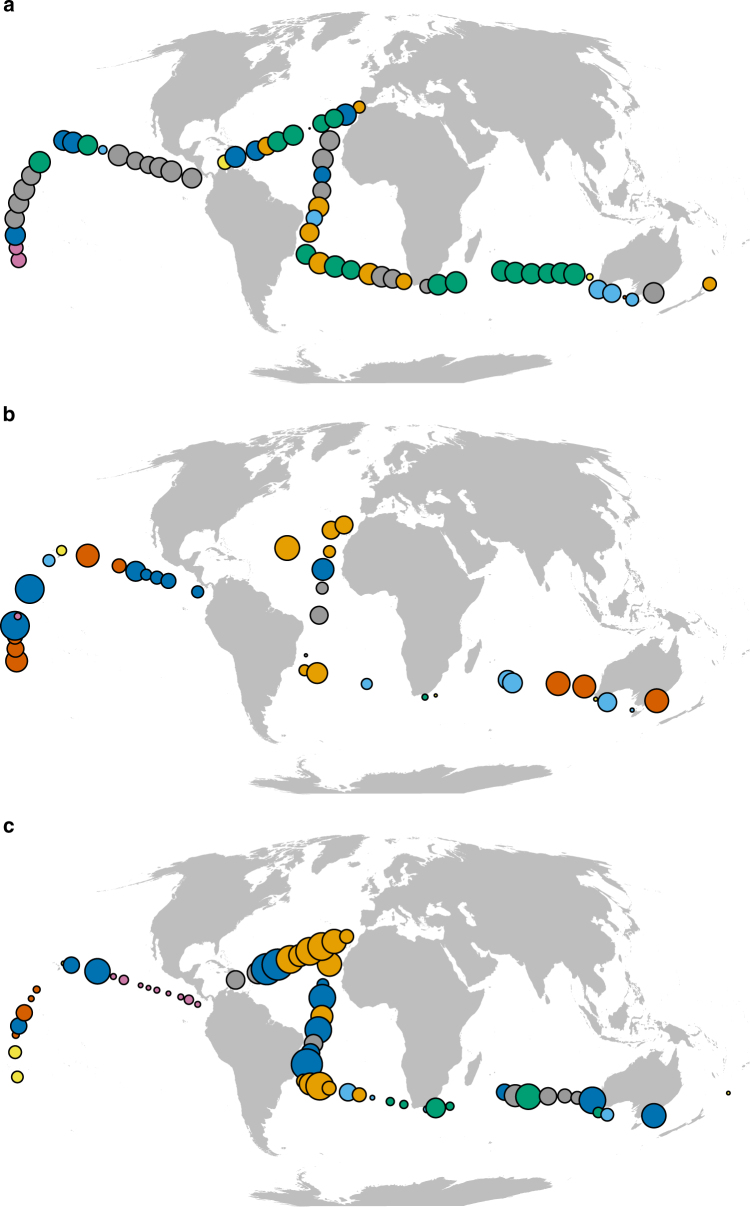
Fig. 4.
Spatial community patterns. Hierarchical clustering based on the Jaccard similarity index for, a diatoms 0–160 m, b mesozooplankton 0–200 m, and c myctophids. Each color represents a different hierarchical cluster. The size of stations indicates the number of connections (i.e., species/OTUs similarity between sites), that is, larger sized circles share more species (or OTUs) within all stations, compared to small sized circles. Some stations have been aggregated based on proximity for clarity

