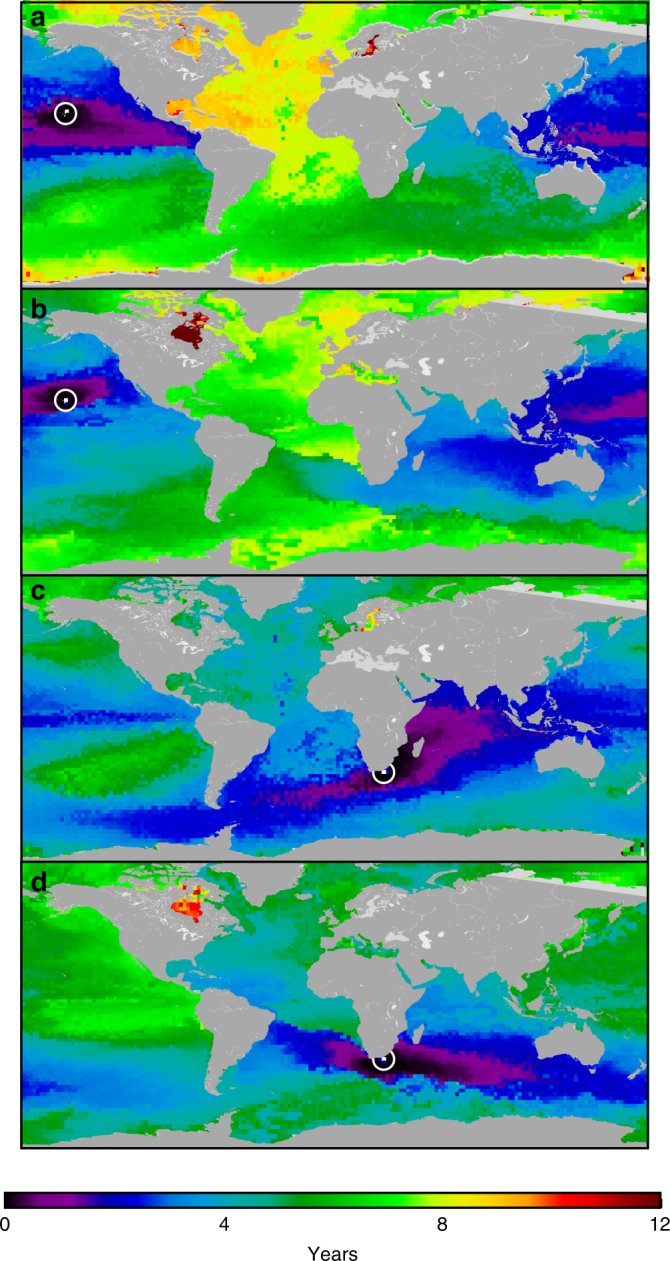
Fig. 5.

Surface ocean transit times. Examples of minimum connection times to and from two locations identified by white circle-dots in two random Malaspina stations: off Hawaii (a, b) and off South Africa (c, d). Times ‘to’ are the shortest times taken for water from other patches to arrive at these locations. Times ‘from’ are the shortest times taken for water from these locations to go to all others. Minimum ocean transit time values were generated using Dijkstra’s algorithm (Methods section)
