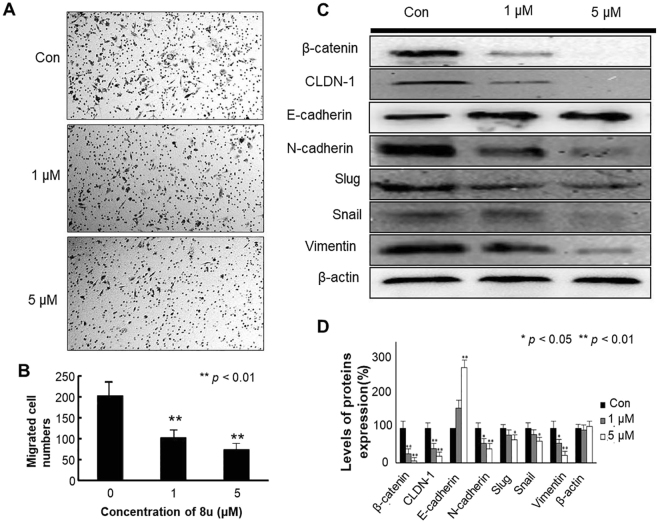
Figure 2.
Effects of 8u on the migration and invasion capabilities in HepG2 cells. (A) Migration of HepG2 cells that underwent 8u treatment was determined in transwell invasion assay. HepG2 cells, after 6 h pretreatment with vehicle or indicated concentration of 8u, were added in the top chamber and allowed to invade for 24 h. Trypan blue-stained cells represent the fraction of cells that migrated from the top to the bottom chamber of the membrane. Three independent experiments were examined and representative images were presented. (B) Quantification of invasive HepG2 cells in the bottom chamber. (C) Expression levels of β-catenin, CLDN-1, E-cadherin, N-cadherin, Slug, Snail, Vimentin in cells treated for 48 h with 0, 1, 5 μM 8u. (D) The densitometry performed on the western blotting. Data are expressed as mean ± Standard Deviation (SD). Compared with the control group: *p < 0.05, **p < 0.01.

