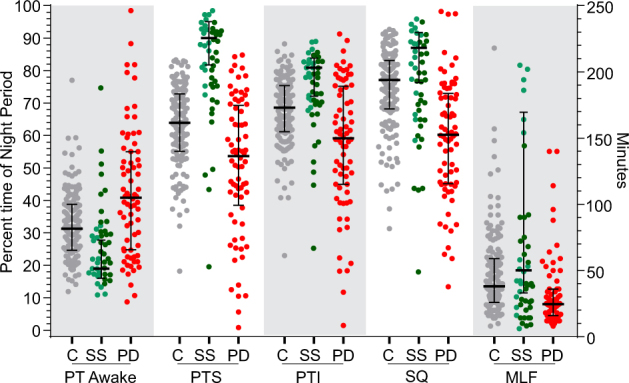
Fig. 2.

The distribution of PKG sleep parameters in Controls, PwP and during Sleep Studies. This shows the PTA, PTI, PTS and SQ (as percentages, left Y axis) and MLF (shown in minutes, right Y axis). Controls subjects (C, are shown as grey circles), subjects who had Polysomnography (sleep study—SS, as green circles, with those reported as normal, or normal with caveats, in light green circles) and PwP (PD, as red circles). The bars show median and interquartile range (in the case of subjects having PSG, the bars are for the data from normal subjects)
