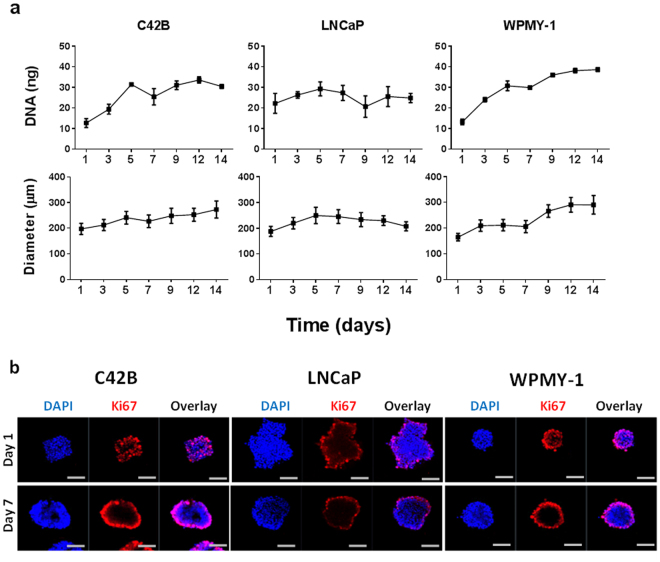
Figure 4.
Characterisation of prostate cancer cell lines in 3D micro-tumour culture. (a) Prostate cancer (C42B and LNCaP) and prostate myofibroblasts (WPMY-1) cell lines were cultured in the 3D platform (600 cells/spheroid) and the growth of cell spheroids was assessed by DNA quantification and spheroid diameter measurement. DNA quantification data represents the mean value of four replicate cultures. A minimum of 50 spheroids were measured per time point for diameter measurement. (b) Confocal images of spheroids (600 cells/spheroid) stained with Ki67 (red) and nuclear stain (DAPI; blue) were acquired on day 1 and 7 of culture. Scale bar = 100 µm.

