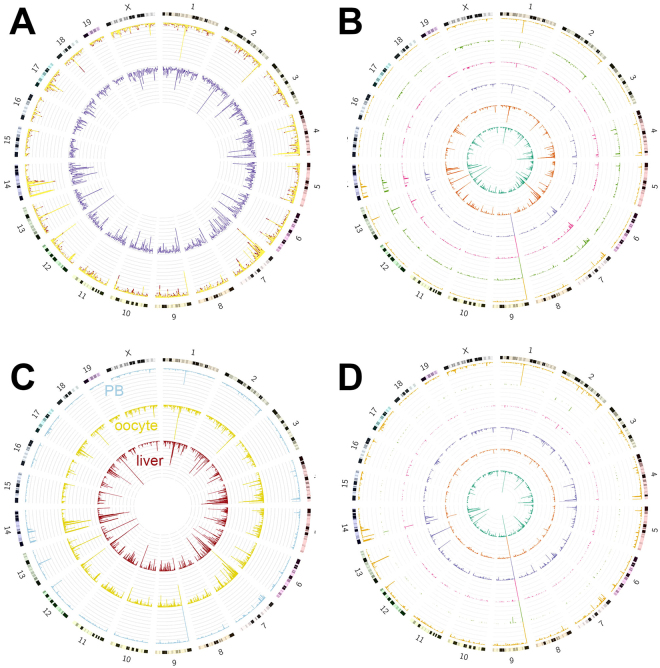
Figure 2.
Distribution of variants on the mouse genome. (A) The outer bars show the number of heterozygous variants in each 1 Mb genomic region, with yellow for recombined heterozygous variants and red for non-recombined heterozygous variants. The inner purple bars show the ratio of heterozygous sites to homozygous sites in each 1 Mb genomic region. (B) Each circle shows the number of recombined heterozygous variants in 1 Mb genomic regions, detected in a single nucleus. (C) Numbers of heterozygous sites in each 1 Mb genomic region in liver tissue, oocytes and PB1 (first polar body) counterparts are shown. (D) Each circle shows the number of recombined heterozygous variants in 1 Mb genomic regions, detected in a single PB1.

