Fig. 2.
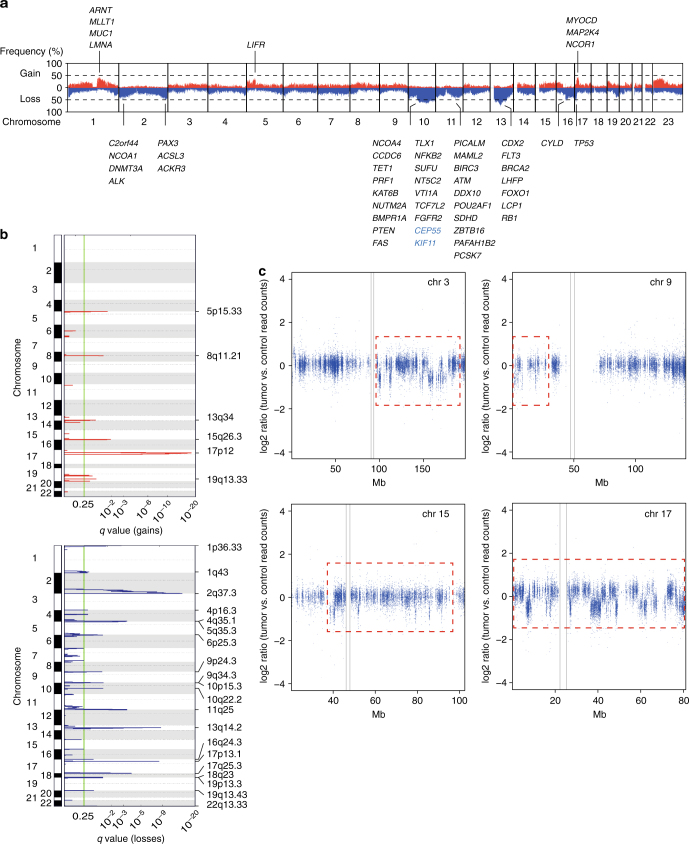
Genomic imbalances in adult LMS. a Overall pattern of CNAs. Chromosomes are represented along the horizontal axis, frequencies of chromosomal gains (red) and losses (blue) are represented along the vertical axis. Established cancer genes (black) and components of the CINSARC signature (blue) affected by CNAs in at least 30% of cases are indicated. b GISTIC2.0 plot of recurrent focal gains (top) and losses (bottom). The green line indicates the cut-off for significance (q = 0.25). c Read-depth plots of case LMS24 showing oscillating CNAs of chromosomes 3, 9, 15, and 17 (red dotted lines), indicative of chromothripsis. Gray lines indicate centromeres. Mb megabase, chr chromosome

