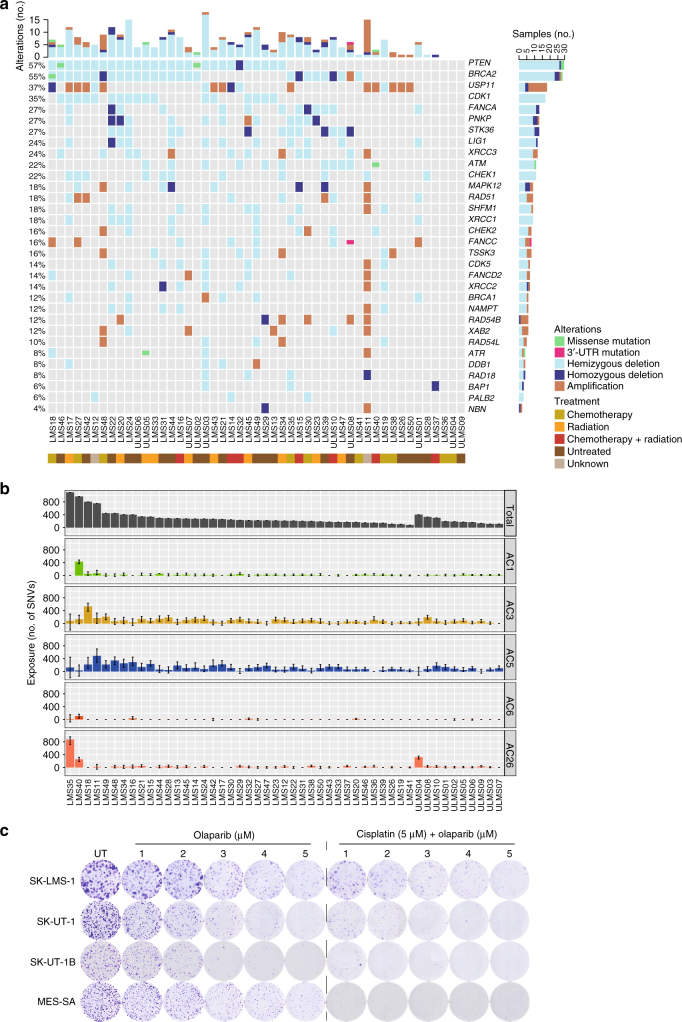
Fig. 7.
Evidence for BRCAness in adult LMS. a Alterations in genes reported as synthetic lethal to PARP inhibition. Rows represent individual genes, columns represent individual tumors. Genes are sorted according to frequency of SNVs, indels, and CNAs (left). Bars depict the number of alterations for individual tumors (top) and genes (right). Types of alterations and treatment history are annotated according to the color codes (bottom). UTR untranslated region. b Contribution of mutational signatures to the overall mutational load in LMS tumors. Each bar represents the number of SNVs explained by the respective mutational signature in an individual tumor. Error bars represent 95% confidence intervals. AC Alexandrov-COSMIC. c Clonogenic assays showing dose-dependent sensitivity of LMS cell lines to continuous olaparib treatment (1–5 µm) with or without prior exposure to a 2-h pulse of cisplatin (5 µm). UT untreated

