Fig. 2.

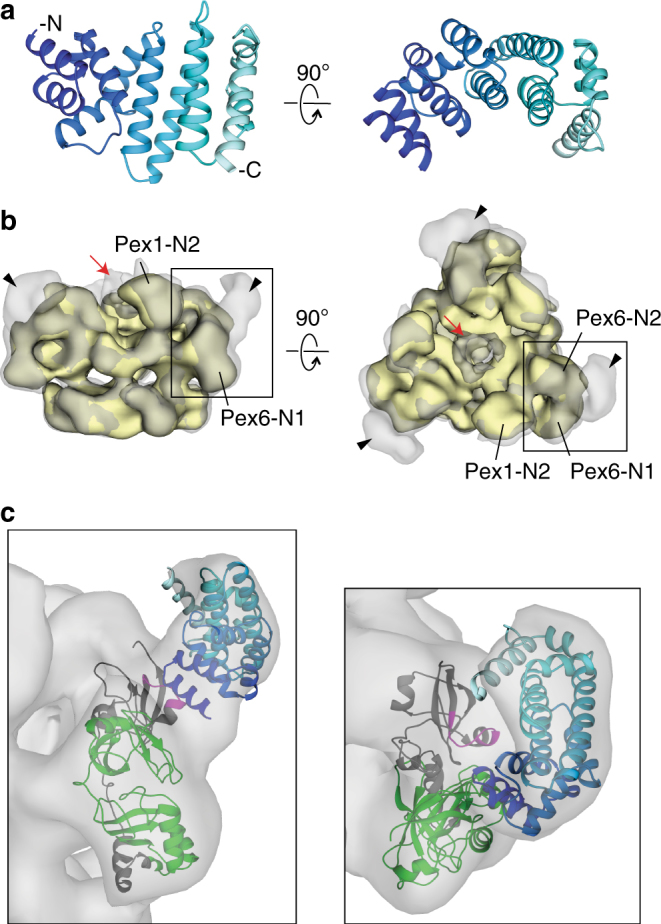
Structure of the Pex15 core domain and its interaction with Pex1/Pex6. a A ribbon diagram of Pex15’s core domain (aa 43–253) is shown in a blue spectrum with the darkest blue at the N terminus (see also Supplementary Figure 1C). b 3D reconstructions from negative-stain EM of wild-type Pex1/Pex6 alone (yellow, EMD-6254) and in complex with the cytosolic domain of Pex15 (aa 1–327) at 23.2 Å resolution (gray, EMD-7005), showing additional density above the Pex6 N-terminal domains (arrowhead) and the central pore (red arrow) (see also Supplementary Figure 2). c Close-up views of the rigid-body fit of the Pex15 crystal structure (blue spectrum as in a) in the additional density above the Pex6 N-terminal domains. An atomic model of the Pex6 N-terminal domains20 in ribbon representation is colored gray, with the regions protected by Pex15 in the HDX-MS experiments in green (the N1 domain) and magenta (Pex6 aa 241–250) (see also Supplementary Figures 3, 4 and Supplementary Table 2)
