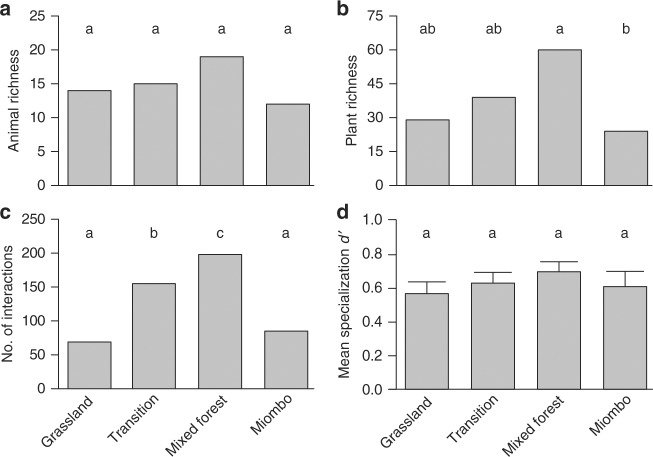
Fig. 4.
Network- and species-level descriptors of the interactions from each habitat of Gorongosa. Differences among the main habitats of Gorongosa in terms of a animal species richness, b plant species richness, c number of interactions, d species specialization (mean ± SEM). Different letters indicate statistical pairwise differences: a–c, pairwise G tests (see Supplementary Table 2 for full results); d, generalized linear mixed models (63 observations/occurrences of 32 animal species in four habitats; Supplementary Table 3 for full results)

