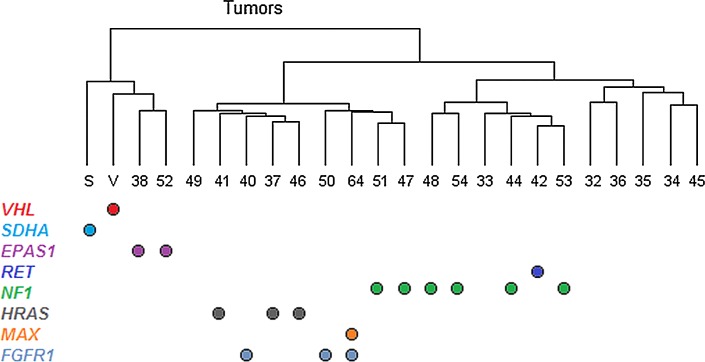
Fig. 3.
Hierarchical clustering of tumors based on gene expression levels. Mutation status is indicated below the dendrogram, showing that tumors with FGFR1 mutations cluster together with those that have RET, NF1, or HRAS mutations. Whereas mutations in the known susceptibility genes were mutually exclusive, one mutation in the novel susceptibility gene, FGFR1, occurred in combination with a somatic MAX mutation

