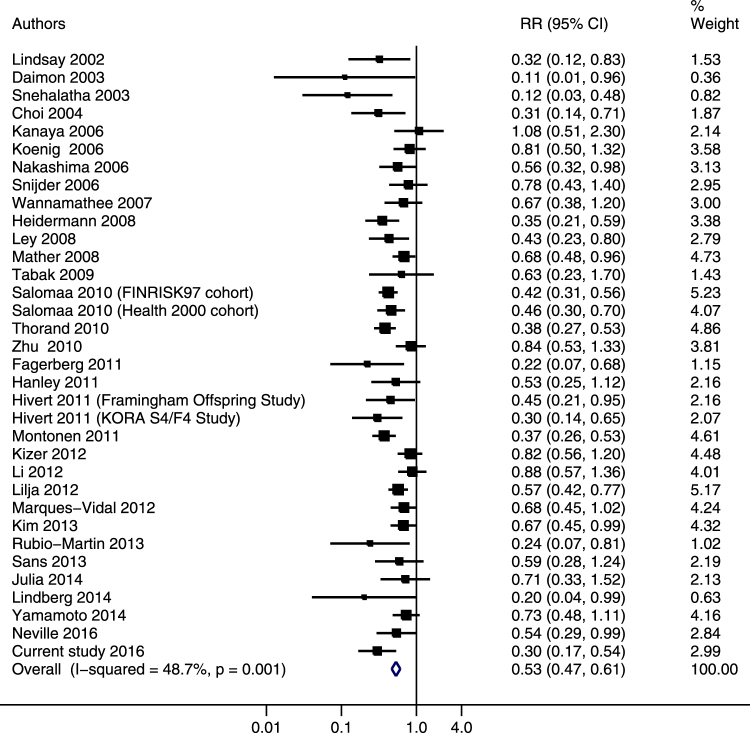
Figure 1.
Adjusted relative risks of adiponectin levels with risk of type 2 diabetes in the updated meta-analysis. The summary estimates were obtained from the most fully-adjusted models of each study using a random-effects model. The data markers indicate the adjusted relative risks (RRs) comparing extreme tertiles of adiponectin levels. The size of the data markers indicates the weight of the study, which is the inverse variance of the effect estimate. The diamond data markers indicate the pooled RRs.

