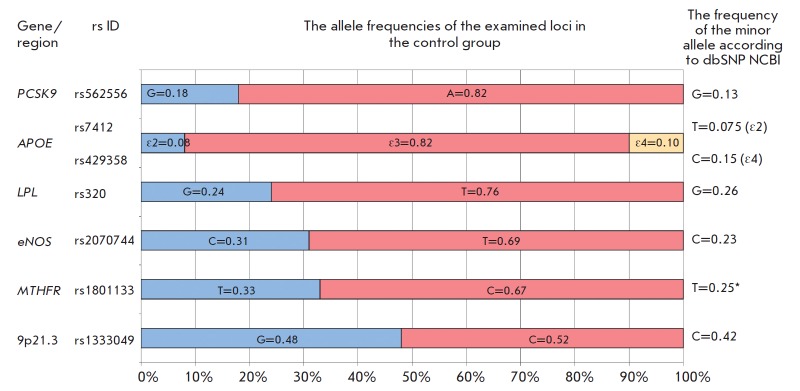
Fig. 1.
The allele frequencies of the examined loci in the control group (ethnic Russians) as compared to the allele frequencies from the dbSNP NCBI database [25]. *In the dbSNP NCBI database, minor allele frequency (MAF) is shown for the complementary chain.

