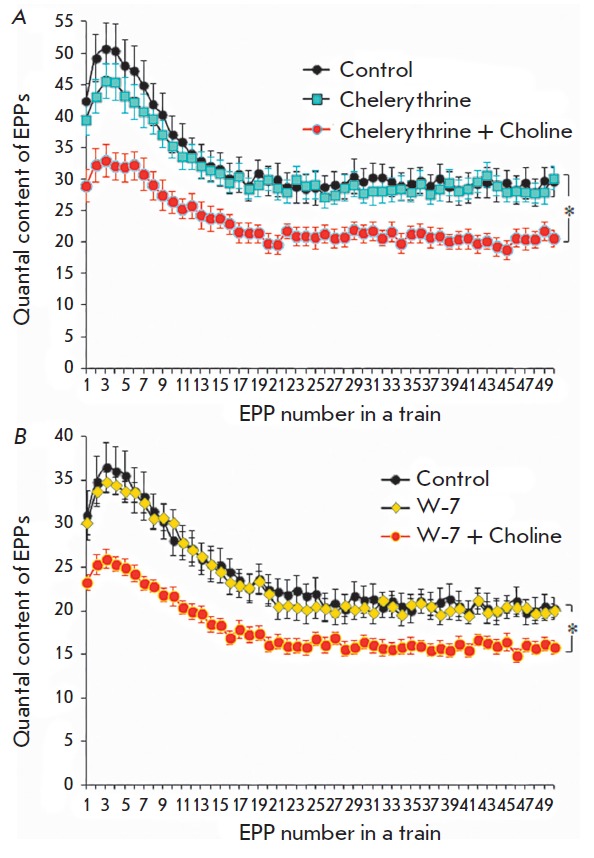
Fig. 2.

Changes in the quantal content during short-term rhythmic trains of EPPs with a frequency of 50 Hz: A – in the control, after chelerythrine (4 μM) was applied and after choline (100 μM) was added in the presence of preapplied chelerythrine. B – in the control (n = 17), after application of W-7 (10 μM) (n = 15) and when choline (100 μM) was added in the presence of pre-applied W-7 (n = 18). The Y axis shows the quantal content of EPPs; the X axis shows the EPP number in a short train. * p < 0.05 with respect to the control values
