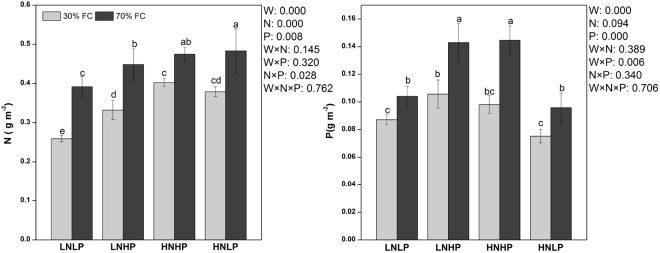
Figure 1.
Leaf N content per leaf area (N) and leaf P content per leaf area of Moso bamboo under different treatments. Different letters above bars denote statistically significant differences between treatments at the P < 0.05 level according to Tukey’s test. The significance of the factorial analysis (analysis of variance): W, watering effect; N, nitrogen effect; P, phosphorus effect; W × N, watering and nitrogen interaction effect; W × P, watering and phosphorus interaction effect; N × P, nitrogen and phosphorus interaction effect; W × N × P, watering, nitrogen and phosphorus interaction effect. Watering regime [30% (grey bars) or 70% (black bars) of the field capacity] is shown.

